Trace-Driven Debugging vs Log-Based Debugging for LLM Agents
Traces capture causal order that logs cannot, making silent agent failures visible.
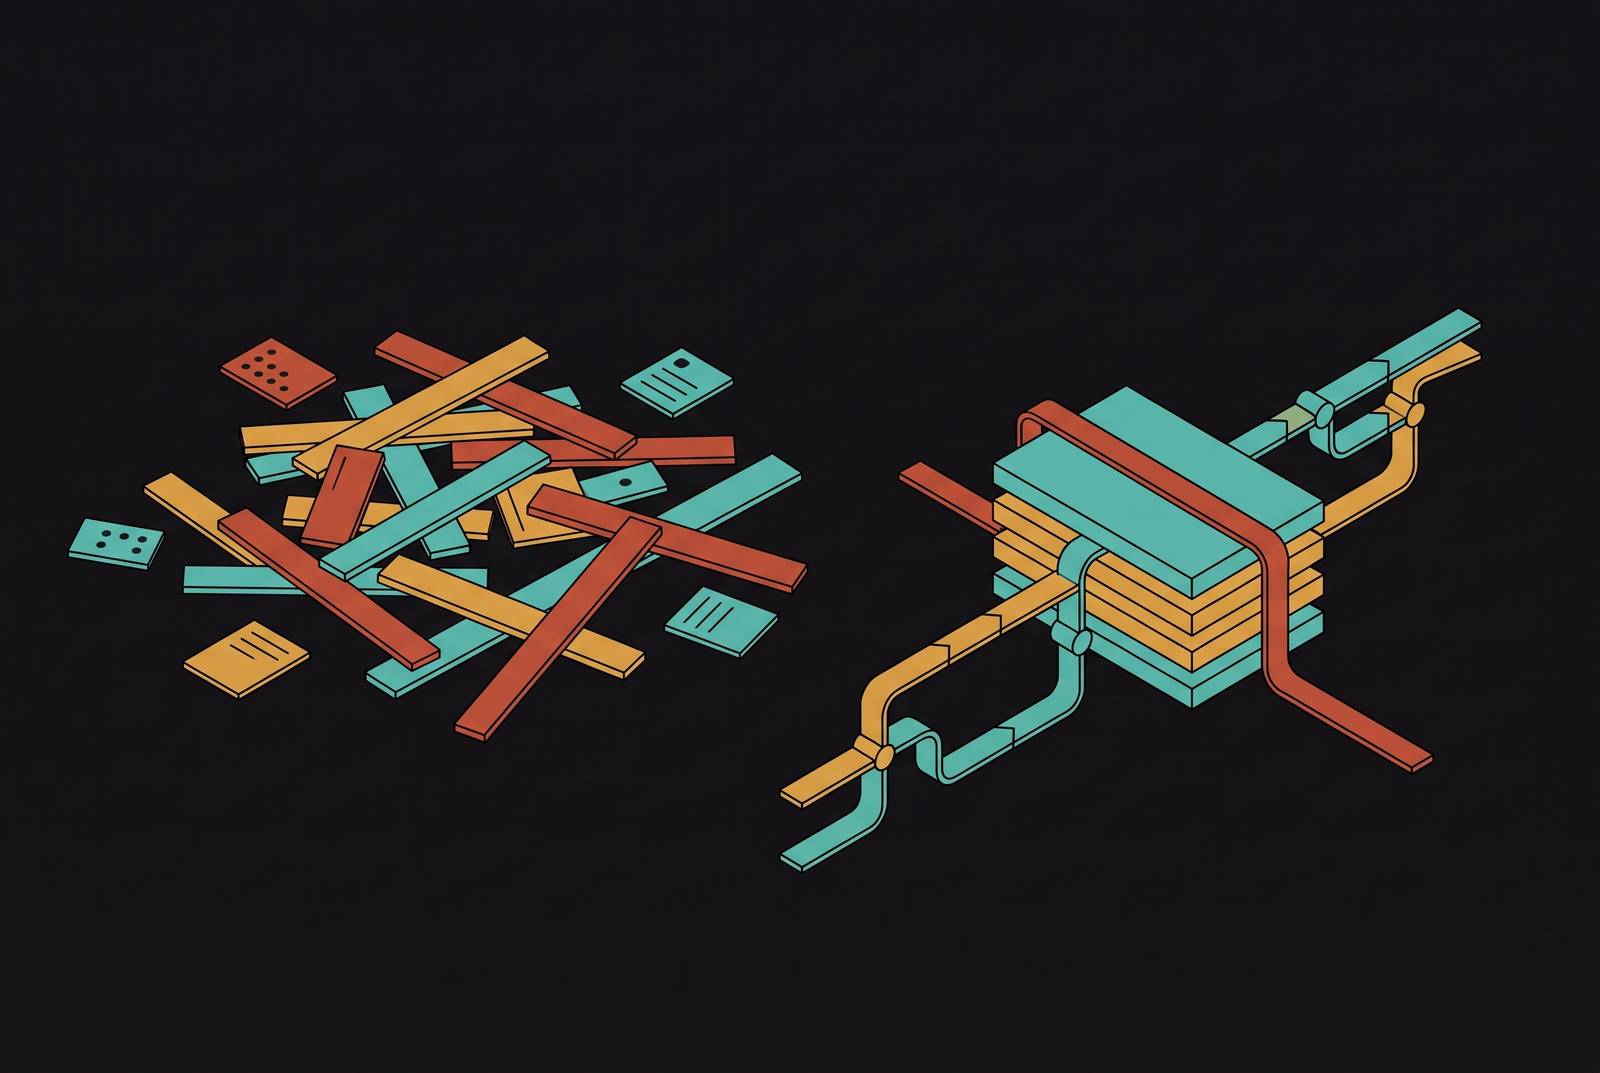
Log-based debugging works when a system is deterministic: give it the same input twice, get the same output twice, and a line in the log maps back to a specific line of code with no ambiguity. LLM agents have a non-deterministic, LLM-decided path with a variable number of steps (1 to 50+), errors that can be subtle, latency that varies 10x based on reasoning path, and cost that varies with tokens consumed, unlike traditional applications, which have a deterministic flow, a fixed number of steps, clear errors, and predictable latency.
An agent doesn't follow a fixed execution path. Step count isn't fixed either: a request might resolve in a single model call or fan out past fifty steps before it produces an answer. Traditional software gives you loud failure, such as an exception, a stack trace, a non-zero exit code, or something a monitoring dashboard can flag red. An agent's failure mode is quieter and more dangerous. The output is well-formed, grammatically clean, confidently stated, and wrong, with no exception thrown anywhere in the chain.
That's the surface issue. The deeper one is structural. Nothing in a flat log tells you that the second line was caused by the first. You can infer it, if you're lucky and the timestamps are close and nothing else was running concurrently, but inference isn't the same as record. Causal order across layers, tool call to model response to next tool call, is exactly the thing a log was never built to preserve, and it's exactly the thing you need to debug an agent that failed silently. Non-deterministic, LLM-decided execution path (the agent chooses which tools to call and in what order). The specific thing logs cannot recover is causal order across layers, a log line from a tool call and a log line from the LLM response that follows it sit in the same flat stream with no structural link between them.
How agents fail: the failure modes that flat logs bury
The scale of the problem is real and documented. That's not a long tail of exotic edge cases. That's the bulk of the failure surface, coming from two causes that have nothing to do with model capability and everything to do with how the harness is built.
Four failure categories recur across production agents, and flat logs bury all four. Silent context corruption happens when one agent passes incomplete or irrelevant context downstream to another agent, which then produces a response that reads as confident and is actually wrong, with no error thrown anywhere in the handoff. Hallucination propagation is worse in a specific way: an agent fabricates a tool output, or invents data it never actually retrieved, and that fabrication at step two quietly corrupts every step that follows it. The log shows you the final output. It does not show you where the fabrication started.
A 2026 study on agent drift split workflow loops and drift, a third category, into three distinct types: semantic drift, where the agent gradually departs from the original intent of the task; coordination drift, where consensus breaks down across a multi-agent system; and behavioral drift, where the agent develops strategies nobody designed for. Instability tends to live at the process level, in skipped steps, misordered operations, premature termination, rather than in the model simply being incapable of the task.
The fourth category is tool schema drift, and it has a real postmortem attached to it. In a February 2026 postmortem, after upgrading from n8n v2.4.7 to v2.6.3, the platform began generating invalid tool schemas in tool calls, breaking both OpenAI and Anthropic integrations simultaneously. The argument schema had simply changed between versions, and there was no mechanism in place to surface that change to the harnesses consuming the tool. Schema drift usually doesn't throw an error. It produces a response that's malformed but plausible enough to pass downstream, undetected, until a human notices the outputs have gone wrong.
A bad tool argument at step two propagates through subsequent decisions, making the observable symptom of a wrong final answer structurally disconnected from that originating cause. Part of what makes this so hard to pin down is that agent state is recorded in natural language, and natural language is inherently ambiguous in a way that resists precise characterization of what the system actually did or believed at a given moment. That part's obvious. It's "which layer, exactly, caused it," and a flat log has no mechanism to answer that. Multi-agent systems fail at rates between 41–86.7% in production, and specification ambiguity and unstructured coordination protocols account for 79% of production breakdowns, per the MAST failure taxonomy validated across 1,600+ execution traces.
What a structured trace captures that a log cannot
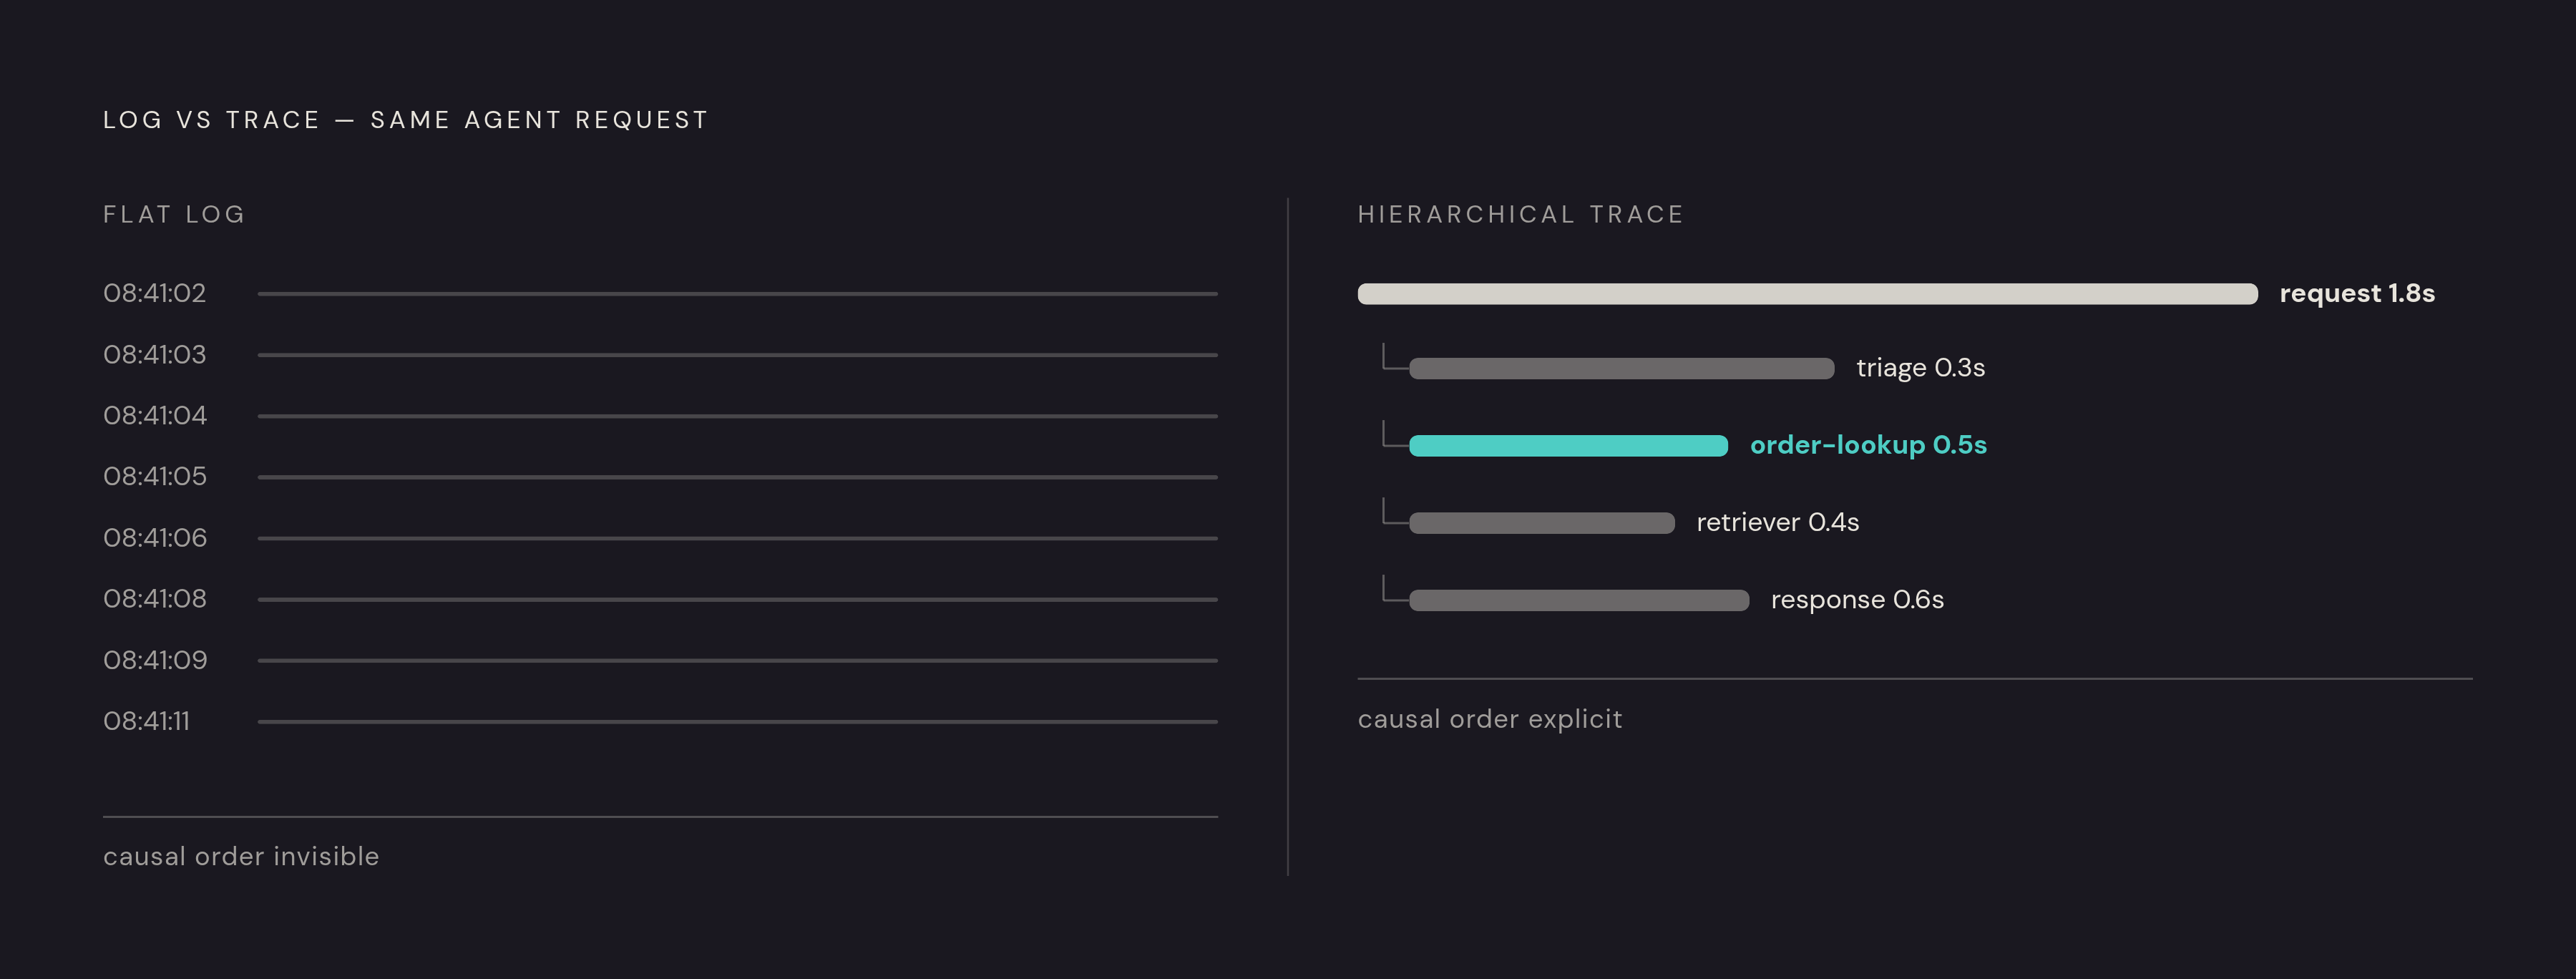
A trace is the answer to that mechanism problem, and it deserves a precise definition rather than a loose analogy. A trace captures the full lifecycle of a single agent request, every LLM call, every tool invocation, every decision point, every memory read and write, every state transition, as a causally ordered, hierarchical structure. The word doing the real work there is hierarchical. A trace records every tool invocation, every decision point, every memory read and write, every state transition, as a causally ordered, hierarchical structure, and it is a tree. It's a tree.
Picture a customer support agent handling an order-status question. The trace, call it a generated identifier, has a root span covering the entire request from start to finish. Underneath that root, a triage span figures out what the customer is asking. Underneath triage, an order-lookup span calls out to a tool, an API or a database, with specific arguments and a specific return value attached to that span, and a retriever span might sit alongside it if the agent needs to pull from a knowledge base or vector store. Finally a response span, itself an LLM call, takes what came back from the lookup and turns it into the sentence the customer actually reads. Every one of those spans links back to its parent, so the tree is fully reconstructable end to end, and every span carries its own input, output, timing, cost, status code, error type, and, where available, an evaluation score.
That's the structural difference from a log line, and a span isn't a narrative sentence describing what happened, it's a structured record you can inspect at the attribute level. When the final answer to the customer is wrong, you don't have to guess. You walk backward through the tree and ask, at each span, a checkable question. Was the data it was handed misinterpreted by the response span? Did the tool span return something stale? Did triage route to the wrong sub-agent in the first place? Each of those questions maps to one span you can open and inspect, rather than a paragraph you have to reconstruct from adjacent log lines.
There's a reason this matters beyond any single incident. Observability records like traces serve two separate purposes, one external and one internal: externally, they support debugging, compliance auditing, and post-incident analysis, and internally, they close the feedback loop that connects an execution outcome back to the specific module that produced it. An agent that acts without leaving behind an inspectable trace is an agent that cannot be debugged, cannot be audited, and, perhaps more importantly for anyone trying to ship improvements, cannot be improved, because there's no record connecting its outcomes back to its own internal decisions.
OpenTelemetry GenAI standard portability in practice
None of this is useful as a concept alone. It needs a standard, or every team ends up building its own bespoke tracing format that only works with its own bespoke tooling. OpenTelemetry is the open standard for traces, metrics, and logs, and it addresses the GenAI gap through its GenAI semantic conventions, a common vocabulary of gen_ai.* attributes for model calls, token-usage metrics, and tool and agent spans. That vocabulary is what lets a tool span from one team's harness mean the same thing as a tool span from another team's, without either side inventing its own schema.
That caveat aside, adoption has moved fast. Between mid-2025 and mid-2026, the conventions matured to the point that essentially every serious tracing tool emits them, which is what makes a trace captured in one system portable to a completely different backend. Agent-native span types, for tools, retrievers, planners, and child-agent invocations, became first-class citizens in that period too, rather than being crammed into generic internal spans that told you nothing about what kind of operation actually happened.
Portability here has a specific, testable meaning. An application instrumented with OTel GenAI spans can send its traces to Jaeger, to Tempo, to Datadog, to Honeycomb, or to a purpose-built LLM observability platform, without re-instrumenting the application itself. The instrumentation pattern that made this practical wraps an agent function, a tool function, or a chain function with a decorator that handles emitting the span with the right attributes attached. That's a meaningfully lower lift than the custom logging middleware teams were writing two years ago.
Once the spans exist, the actual debugging workflow follows a fairly consistent shape: capture every step as an OpenTelemetry span, visualize the run as a waterfall, follow error propagation, diff against a known-good run, then apply a fix. That's a workflow a flat log simply cannot support, because there's no waterfall to render and no structural diff to take when everything lives in one undifferentiated stream. As of the sources, conventions are in Development status (still experimental), so attribute names can change and practitioners should pin a version, but they are nonetheless already widely adopted and several tools speak them natively.
Comparing the production tooling landscape for trace-driven agent debugging
Older application performance monitoring stacks, the traditional Datadog, New Relic, or Grafana setup, treat an entire agent invocation as a single HTTP call. You get total latency and a top-level error rate, and that's about it, because the LLM call, the retriever query, and every tool invocation the agent made along the way are invisible inside that one call. A wrong tool choice, in that world, appears as a perfectly successful 200 response, because from the APM's point of view, nothing failed. The request came back. It just came back with the wrong answer inside it.
Purpose-built LLM observability platforms exist specifically to close that gap, and they differ from each other in what they emphasize. LangSmith is a framework-agnostic platform (notable given that LangChain and LangGraph reached their v1.0 milestones in October 2025) that captures runs, traces, and threads with step-level cost and latency attribution across LLM generations, tool calls, retrievals, and multi-layer chains. Arize Phoenix builds on OpenTelemetry and the OpenInference standard for trace capture, which keeps its data portable across vendor-agnostic setups, and it supports replaying traces to inspect failures directly, alongside evaluation templates for analyzing model behavior. Braintrust captures complete traces across model calls, tool invocations, and retrieval steps as an expandable tree of nested spans, with each span showing inputs, outputs, timing, cost, and evaluation scores, and it tends to fit teams that want eval-driven release gates wired straight into their CI pipeline.
Maxim AI pairs distributed tracing with agent simulation, letting teams reproduce agent behavior across a range of scenarios and user personas before anything ships to production; it records model calls, tool usage, and intermediate steps at the session, trace, and span levels, and runs deterministic checks, statistical scoring, LLM-as-a-judge evaluation, and human review from within one system. AgentOps offers distributed tracing and behavior analytics, named in the same conversation as LangSmith. Helicone and OpenLLMetry both show up in a 2026 comparison of agent debugging tools as well.
Contrast all of that against what a legacy framework looks like without any of this instrumentation. Some legacy agent environments, Agentverse among them, still require polling a rolling-window log endpoint and scanning raw output for manual logger calls, with no structured log search, no trace visualization, no cost tracking, and no performance metrics at all, showing how much ground the field has covered in a short window. That's a significant obstacle to real work. It's the entire pre-trace era of agent debugging, still running in production, and it makes plain how much ground the field has covered in a short window.
But capturing the spans is only half the job. A production agent can generate thousands of spans a day, and a pile of spans becomes genuinely useful only once something clusters them by failure type, links the observed symptom back to its cause, and tells the engineer which fix to try first. That's an interpretation layer sitting on top of instrumentation, not a replacement for it, and it's the specific problem space that production agent reliability platforms, including the one behind this analysis, are built to address: not just recording that a run happened, but attributing why it went wrong.
Root cause attribution: why knowing a run failed is not the same as knowing why
Knowing that a run failed is cheap. Knowing which layer caused it, the prompt, the tool schema, the workflow sequencing, the memory state, the model call itself, or the surrounding product logic, is the harder and far more consequential problem, and it's where most of the current research effort is concentrated.
Self-correction methods that only work from pass/fail feedback out of a test suite run into a specific failure mode here. TraceCoder research presented at ICSE 2026 found that without insight into a program's actual internal execution, a model making a repair attempt is working from incorrect assumptions, applies a patch that doesn't address the real cause, and can fall into a degenerative loop, cycling between incorrect versions instead of ever converging on a correct one. The absence of internal execution detail is a major gap: without it, a fix lands, while a loop never terminates.
Multi-agent traces make attribution harder still. DoVer, from January 2026, points out that the causally decisive event in a long, branching interaction trace is often buried among a large number of routine, unremarkable operations, and that single-step or single-agent attribution is frequently ill-posed to begin with, since multiple distinct interventions could each independently repair the same failed task. In other words, there's often no single "the" root cause waiting to be found. There can be several valid ones, and a good attribution method has to acknowledge that instead of forcing a single answer.
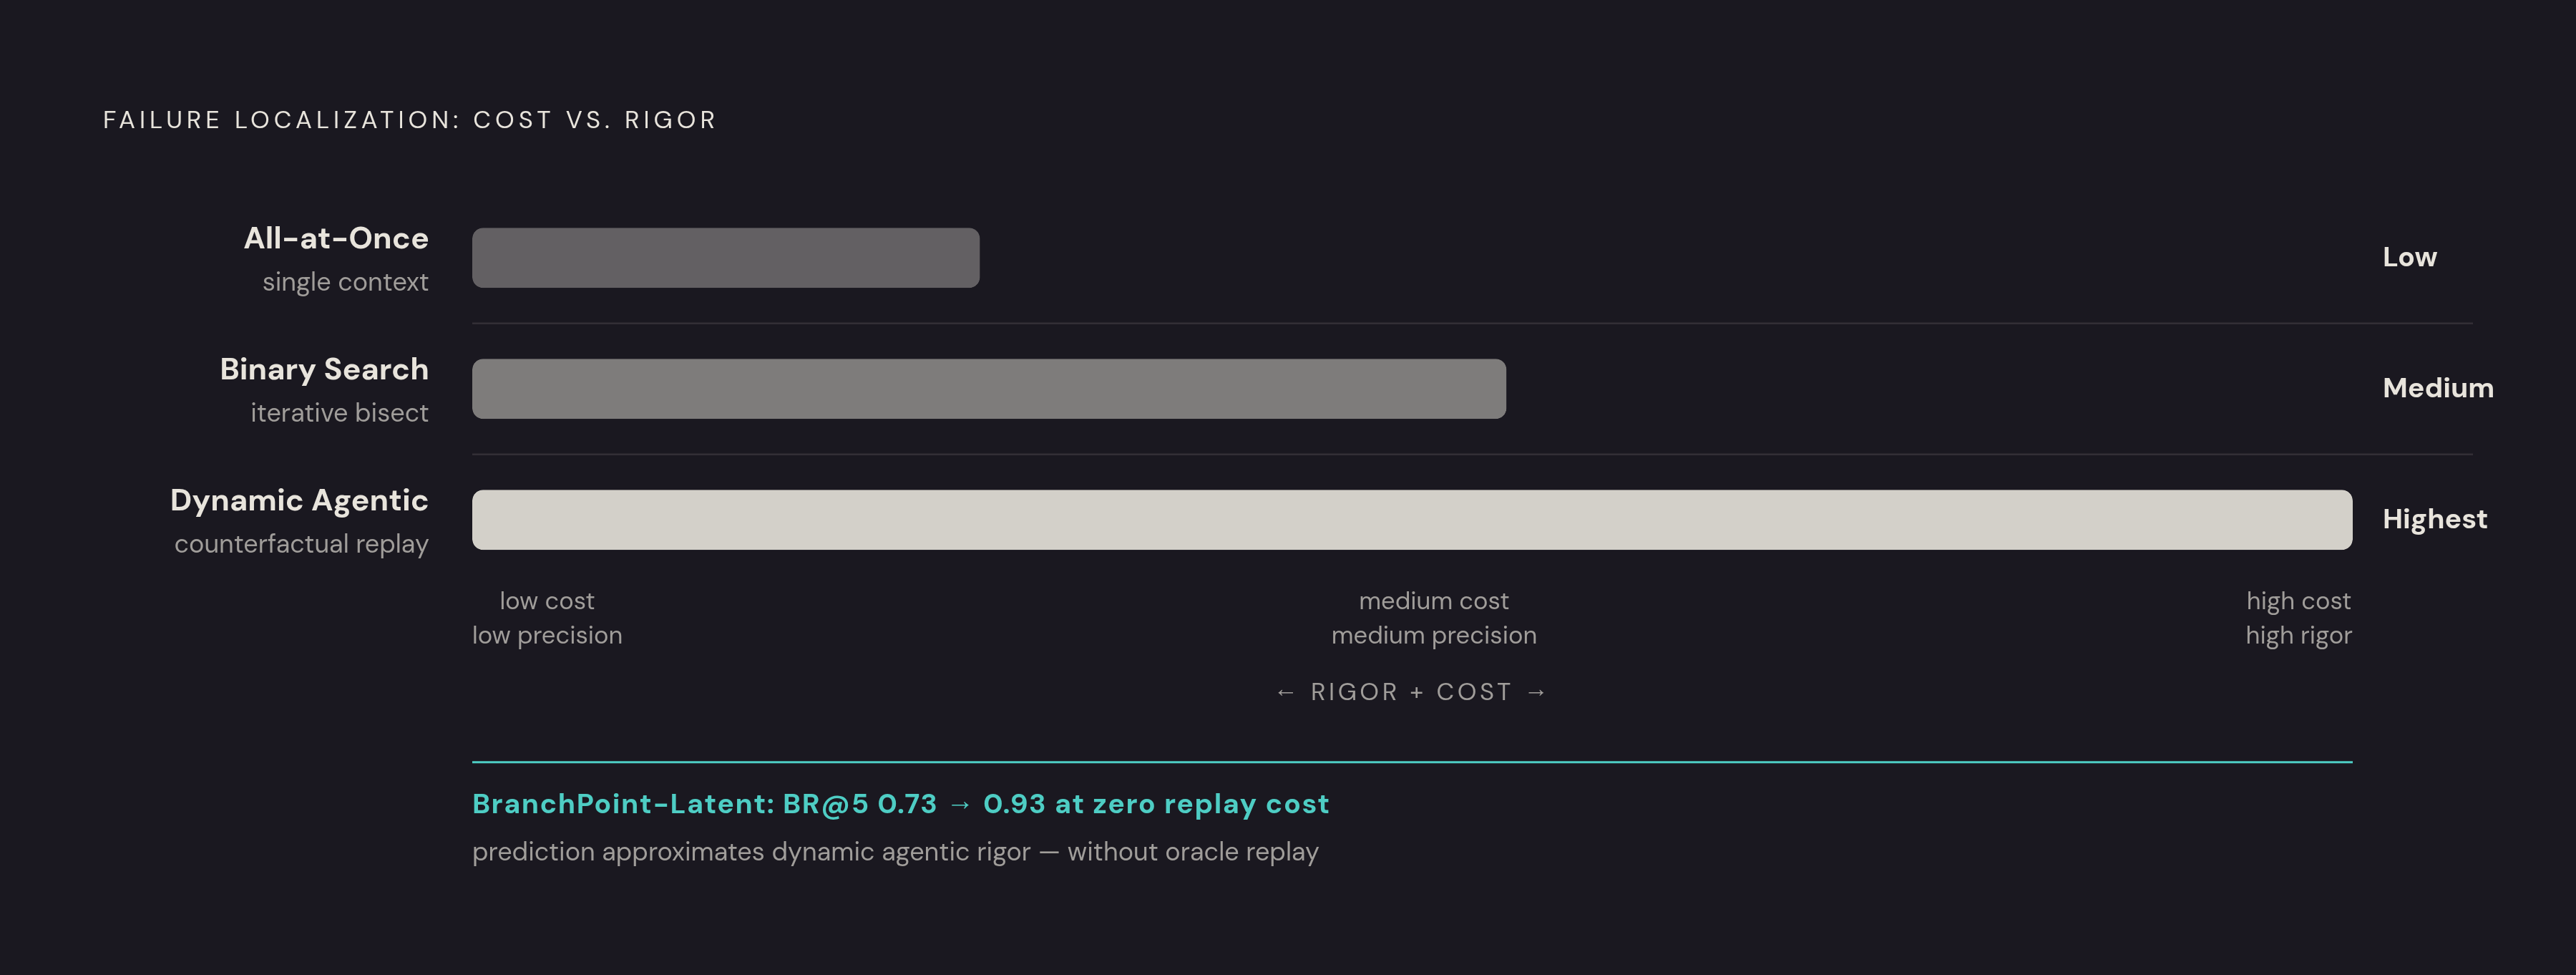
Researchers have tried a handful of prompting strategies for this. All-at-Once feeds the LLM the entire trace in one context window and asks it to find the problem. Binary Search bisects the trace to narrow down the failure region step by step. A Dynamic Agentic approach proposes candidate attributions through static analysis first, then actually re-runs the system from that point in the execution and issues counterfactual checks to confirm or reject the candidate. That last one is the most rigorous, and also the most expensive, since a trace with T events and a family of possible interventions scales the cost of exhaustive counterfactual replay to roughly T times the intervention family size times the number of replay runs, which is not something a production system can afford to do on every failure.
That cost problem is why prediction has become the interesting frontier rather than exhaustive search. The BranchPoint-Latent predictor, from Kang and colleagues, learns to predict which events a replay oracle would flag as high-effect before any replay is actually run, and it lifted per-trace localization, measured as Branch Recall at 5, from 0.73 to 0.93 at zero oracle-replay cost. TrajAudit, published in May 2026, tackles a related problem, long, noisy trajectories that overwhelm a context window, through semantic folding and on-demand evidence retrieval, cutting token usage by at least 18 percent without losing localization accuracy. And the fact that a dedicated benchmark now exists for this exact problem, "Seeing the Whole Elephant," accepted at ACL 2026, matters beyond its specific results: it establishes that failure attribution in multi-agent systems is a measurable engineering discipline with its own metrics, not a matter of engineering intuition or judgment call.
The frontier all of this points toward is a cost-accuracy tradeoff. Exhaustive replay doesn't scale, and skipping attribution entirely leaves every failure as a black box indistinguishable from every other failure. The productive middle ground, and the one the research above is actively converging on, is smart prioritization: predicting which handful of events in a trace are worth the cost of a closer look, then validating a proposed fix by replaying it against the specific failure it's meant to correct before it ever reaches production traffic.
Sources
- TraceCoder: A Trace-Driven Multi-Agent Framework for Automated Debugging of LLM-Generated Code
- DoVer: Intervention-Driven Auto Debugging for LLM Multi-Agent Systems
- Infrastructure for the Agentic Web: Gap Analysis and Architecture from the Agentverse Platform
- Root-Cause Attribution Is a Search Problem: Continual Search for Long-Horizon Agent Failures
- Inside the LLM Call: GenAI Observability with OpenTelemetry | OpenTelemetry