Tracing Tool Call Chains in LangChain and LangGraph Agents
Detect hidden agent failures by tracing tool calls and state transitions across execution steps.
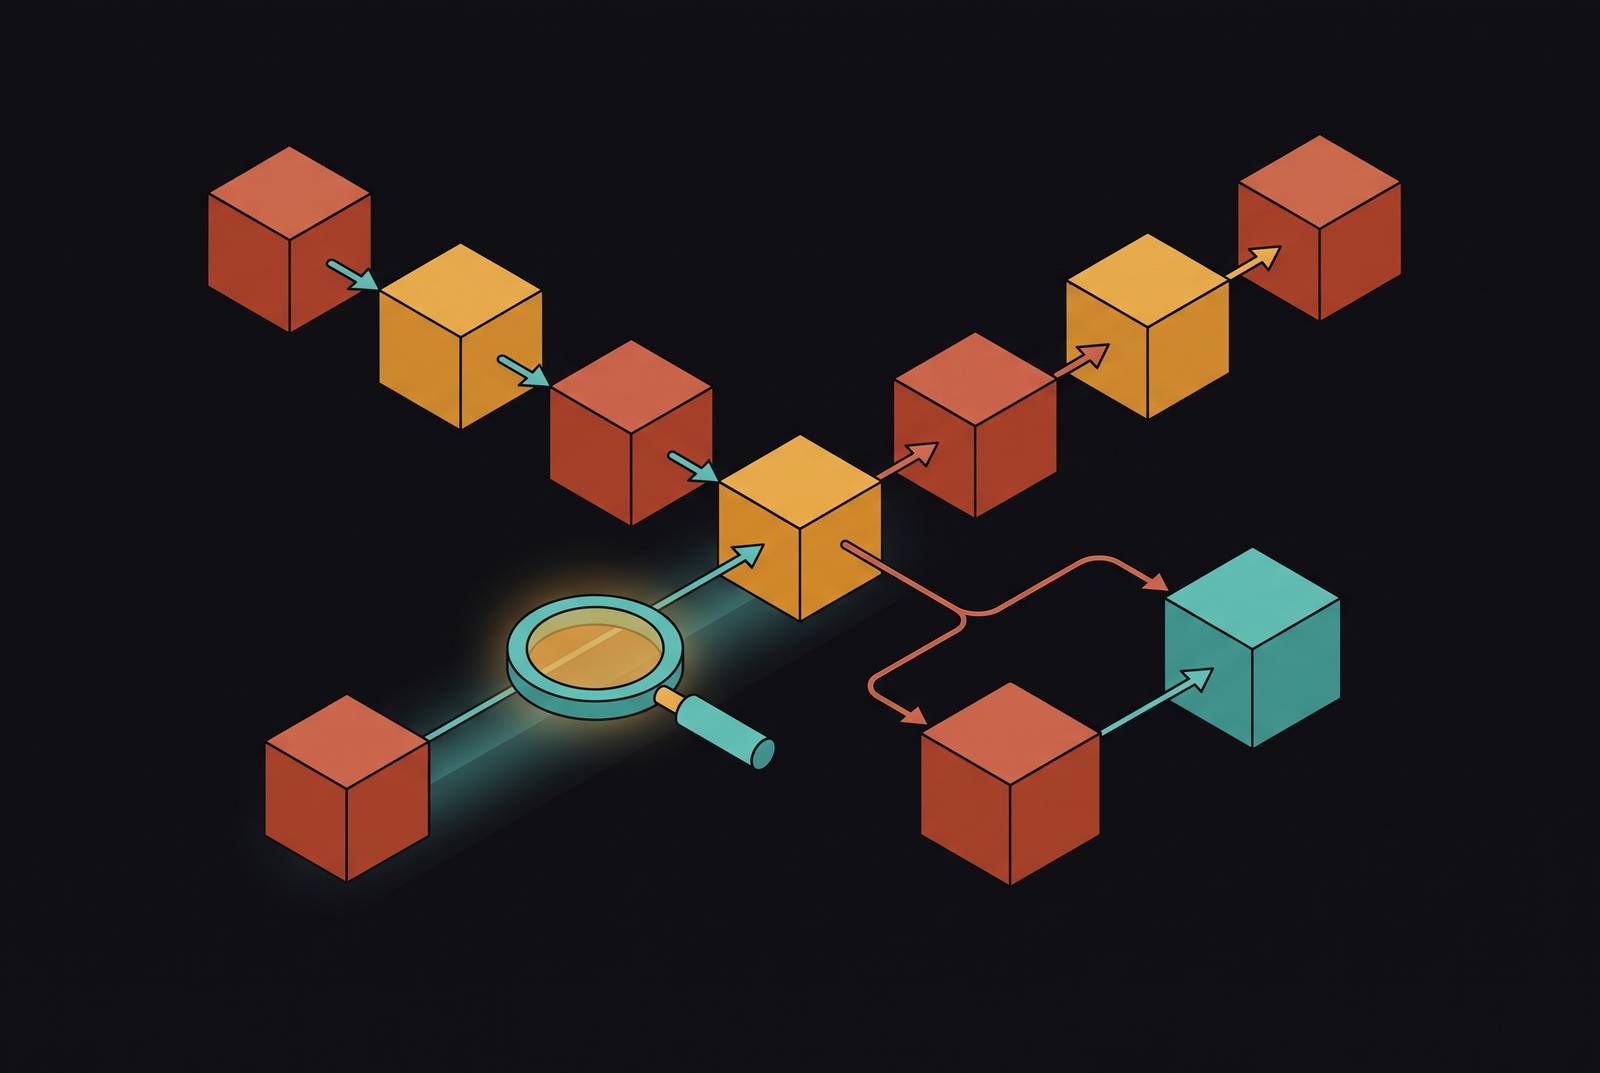
A LangGraph agent can return a clean 200, finish the conversation, and still be badly broken underneath. The state machine misbehaved, the wrong branch fired, or a reducer silently overwrote a constraint set two nodes upstream. Traditional application performance monitoring tells an operator whether a request succeeded at the transport layer, but it has no way to say that the agent looped twice, invoked the wrong tool, or fabricated a billing policy on its way to an answer that reads just fine. That gap between "the request completed" and "the agent behaved correctly" is where production trust in these systems quietly erodes. Tracing exists to close it, and it does that by attributing failure to a cause rather than merely confirming that one occurred.
What LangGraph's architecture exposes to a tracer
LangGraph structures execution as a graph: nodes represent agent or process steps, edges carry explicit conditional routing logic, and state gets checkpointed as it moves through the system. That structure produces a far richer execution record than the older linear input-to-tool-to-output loop that AgentExecutor ran. AgentExecutor was never built for coherent tool-calling across hundreds of steps, for recovering mid-workflow with a defined path back, for coordinating parallel agents, or for pausing a run for human review without losing context, and production systems at companies including Klarna, LinkedIn, Uber, and Replit now depend on exactly those capabilities.
What matters for tracing is what the graph model makes visible that a chain never could: node-level entry and exit state rather than just the final output, the specific conditional branch an edge took and the input that triggered it, whether a resumed run from a checkpoint reconstructs the same state it had before, the handoff payloads passed between parallel subgraphs, and whether a reducer merged, overwrote, or dropped a state field between nodes. None of that surface existed in a linear chain, because a linear chain had no branches to route through and no checkpoints to replay. LangSmith's three-tier hierarchy of runs, traces, and threads was built around this non-deterministic, multi-step execution model specifically, capturing the full tree of LLM calls, tool invocations, retrieval steps, and the reasoning that connects them. The wider the execution surface, the more places a failure can hide, and the more a tracer has to record if it wants to find one.
The four span types
A trace that cannot tell a tool-call failure apart from a reasoning failure, a state transition failure, or a memory failure can confirm that something broke, but it cannot say where. Four span types make up what amounts to a minimum viable agent trace, and each maps to a distinct failure surface inside LangGraph's execution model.
Tool-call spans record the tool name, the arguments passed to it, the raw output it returned, latency, retry count, and any error state. Without that data, a hallucinated argument or a silent retry loop looks identical to normal traffic in an aggregate metrics dashboard.
Reasoning spans capture the model's plan, the action it selected, the observation it made from that action, and what it decided to do next, and this record exposes plan drift and wrong-branch selection, neither of which a single flat LLM span can show on its own.
State transition spans record the agent's working memory before and after each node runs, along with context edits and handoff payloads. This is the span type that catches context loss and the slow summarization drift that degrades a long-running session without ever throwing an error.
Memory operation spans track reads and writes to long-term stores, recording the query issued, the entries returned, their relevance scores, and how fresh they are. Stale reads, retrieval that pulls the wrong entity, and memory leakage between users all live here, and no aggregate metric will ever surface them on its own.
Put together, these four span types form a structured, timestamped record with parent-child links, so a single trace can reconstruct the entire execution graph behind one user request. A typical LangSmith trace runs from the top-level agent invocation, down through each LLM call (the exact prompt sent, the model parameters, the raw response including any tool call request), into the action step where a specific tool gets selected, the inputs handed to that tool, and finally the tool's own execution. That hierarchy is the technical skeleton every diagnostic argument in this piece builds on.
Instrumenting LangChain and LangGraph agents to produce traces worth reading
In production LangGraph agents, a run can return a 200, complete the conversation, and still be broken. They pair it with other components for retrieval, evaluation, or orchestration, so the instrumentation layer has to normalize spans across a mixed stack without forcing a rewrite of everything else. A few genuinely different paths exist here, suited to different team shapes rather than ranked against each other.
LangSmith is the LangChain-native option. Setting the LANGSMITH_TRACING and LANGSMITH_API_KEY environment variables is often enough on its own: LangSmith infers tracing context automatically for LangChain modules running inside LangGraph, with no code changes required for the basic case. For LangGraph runs specifically, passing a config with a thread_id groups traces at the session level across checkpoints. LangSmith's three-tier hierarchy of runs, traces, and threads carries this further with a built-in assistant, Polly, that analyzes complex traces from deep agents running hundreds of steps, and a newer product called LangSmith Engine that monitors production traces on its own, clusters recurring failures into named issues, diagnoses root causes, and proposes fixes. This is a natural fit for teams already built around LangGraph for their control flow.
A framework-agnostic, open-source-first path exists too, built on the same LangChain CallbackHandler pattern: a handler gets passed as a callback at agent invocation, and the same pattern applies to LangGraph without any modification. Tools in this category capture LLM calls, tool invocations, retrievers, retries, latency, and cost automatically. They're available as Langfuse Cloud with a free tier or self-hosted, support Python and JS/TS, and offer regional hosting including EU, US, and Japan. For TypeScript stacks specifically, an OpenTelemetry-native span processor covers the same ground. This suits teams that want to stay framework-agnostic and keep their tracing infrastructure open source.
A third category leans toward evaluation rigor: structured tracing, nested agent spans, and production trace scoring combined into one workflow, with free tiers that typically include a gigabyte or so of processed data and a monthly allowance of evaluation scores. Teams where evaluation quality is the primary concern tend to gravitate here.
For custom or unsupported frameworks, OpenTelemetry provides a fallback path. Native adapters and OTel feeds both ultimately feed the same structured trace pipeline, so the choice of instrumentation method doesn't have to fragment the diagnostic picture downstream.
The three failure patterns that traces expose and human log review misses
Schema drift, prompt-driven loops, and wrong-branch routing cause the most production damage in LangGraph agents. Message-level evaluation checks only whether the final answer looks right, and each pattern leaves a distinct signature in a trace that this check will never catch.
Schema drift is the most concrete of the three and the easiest to miss by eye. When a field name changes, say user_id becomes member_id, the model keeps generating the old key, because its examples, its traces, and its few-shot prompts all still encode the previous name. A tool-call span shows this mismatch explicitly: the argument the model sent, sitting right next to the schema that no longer accepts it. LangGraph adds its own version of this risk at the checkpoint level. Adding a required field to AgentState after checkpoints already exist in production will crash old runs on replay, and the trace is what exposes exactly which checkpoint failed and on which field. The defensive pattern here is straightforward: use Optional fields and state.get() reads instead of direct key access, and the trace confirms whether that guard actually fired when a mismatch occurred. What makes schema drift dangerous in practice is that a run can complete with a wrong state and never throw an error, so the trace is the only place the mismatch is visible before a customer eventually reports it.
Prompt ambiguity produces the second pattern. A node prompt that doesn't acknowledge the possibility of tool failure will drive the agent into a retry loop on that tool, and the trace shows this as repeated tool-call spans with identical inputs and steadily degrading outputs. Without an explicit graph constraining this behavior, two failures recur constantly: the wrong tool executes, sending a refund, a support ticket, or a SQL write to the wrong system, or the loop runs unbounded, turning a confusing user request into a latency and cost incident. A hard guard, something as simple as iteration count reaching 25 and routing to END, appears in the trace as a specific edge firing. Its absence is just as visible: an uninterrupted chain of identical loop iterations with no exit.
The third pattern, silent state overwrites, does the most damage because it produces no visible symptom. LangChain's State of Agent Engineering report found that more than half of production incidents trace back to state management. A reducer overwriting a constraint that a node set two steps upstream can still produce a final answer that reads as entirely correct, even though the state machine driving it is broken. State transition spans record the before-and-after of each node's working memory, and that record is where the overwrite becomes visible. Grading only the final message will never catch this.
Reading a trace to attribute failure to a specific harness layer
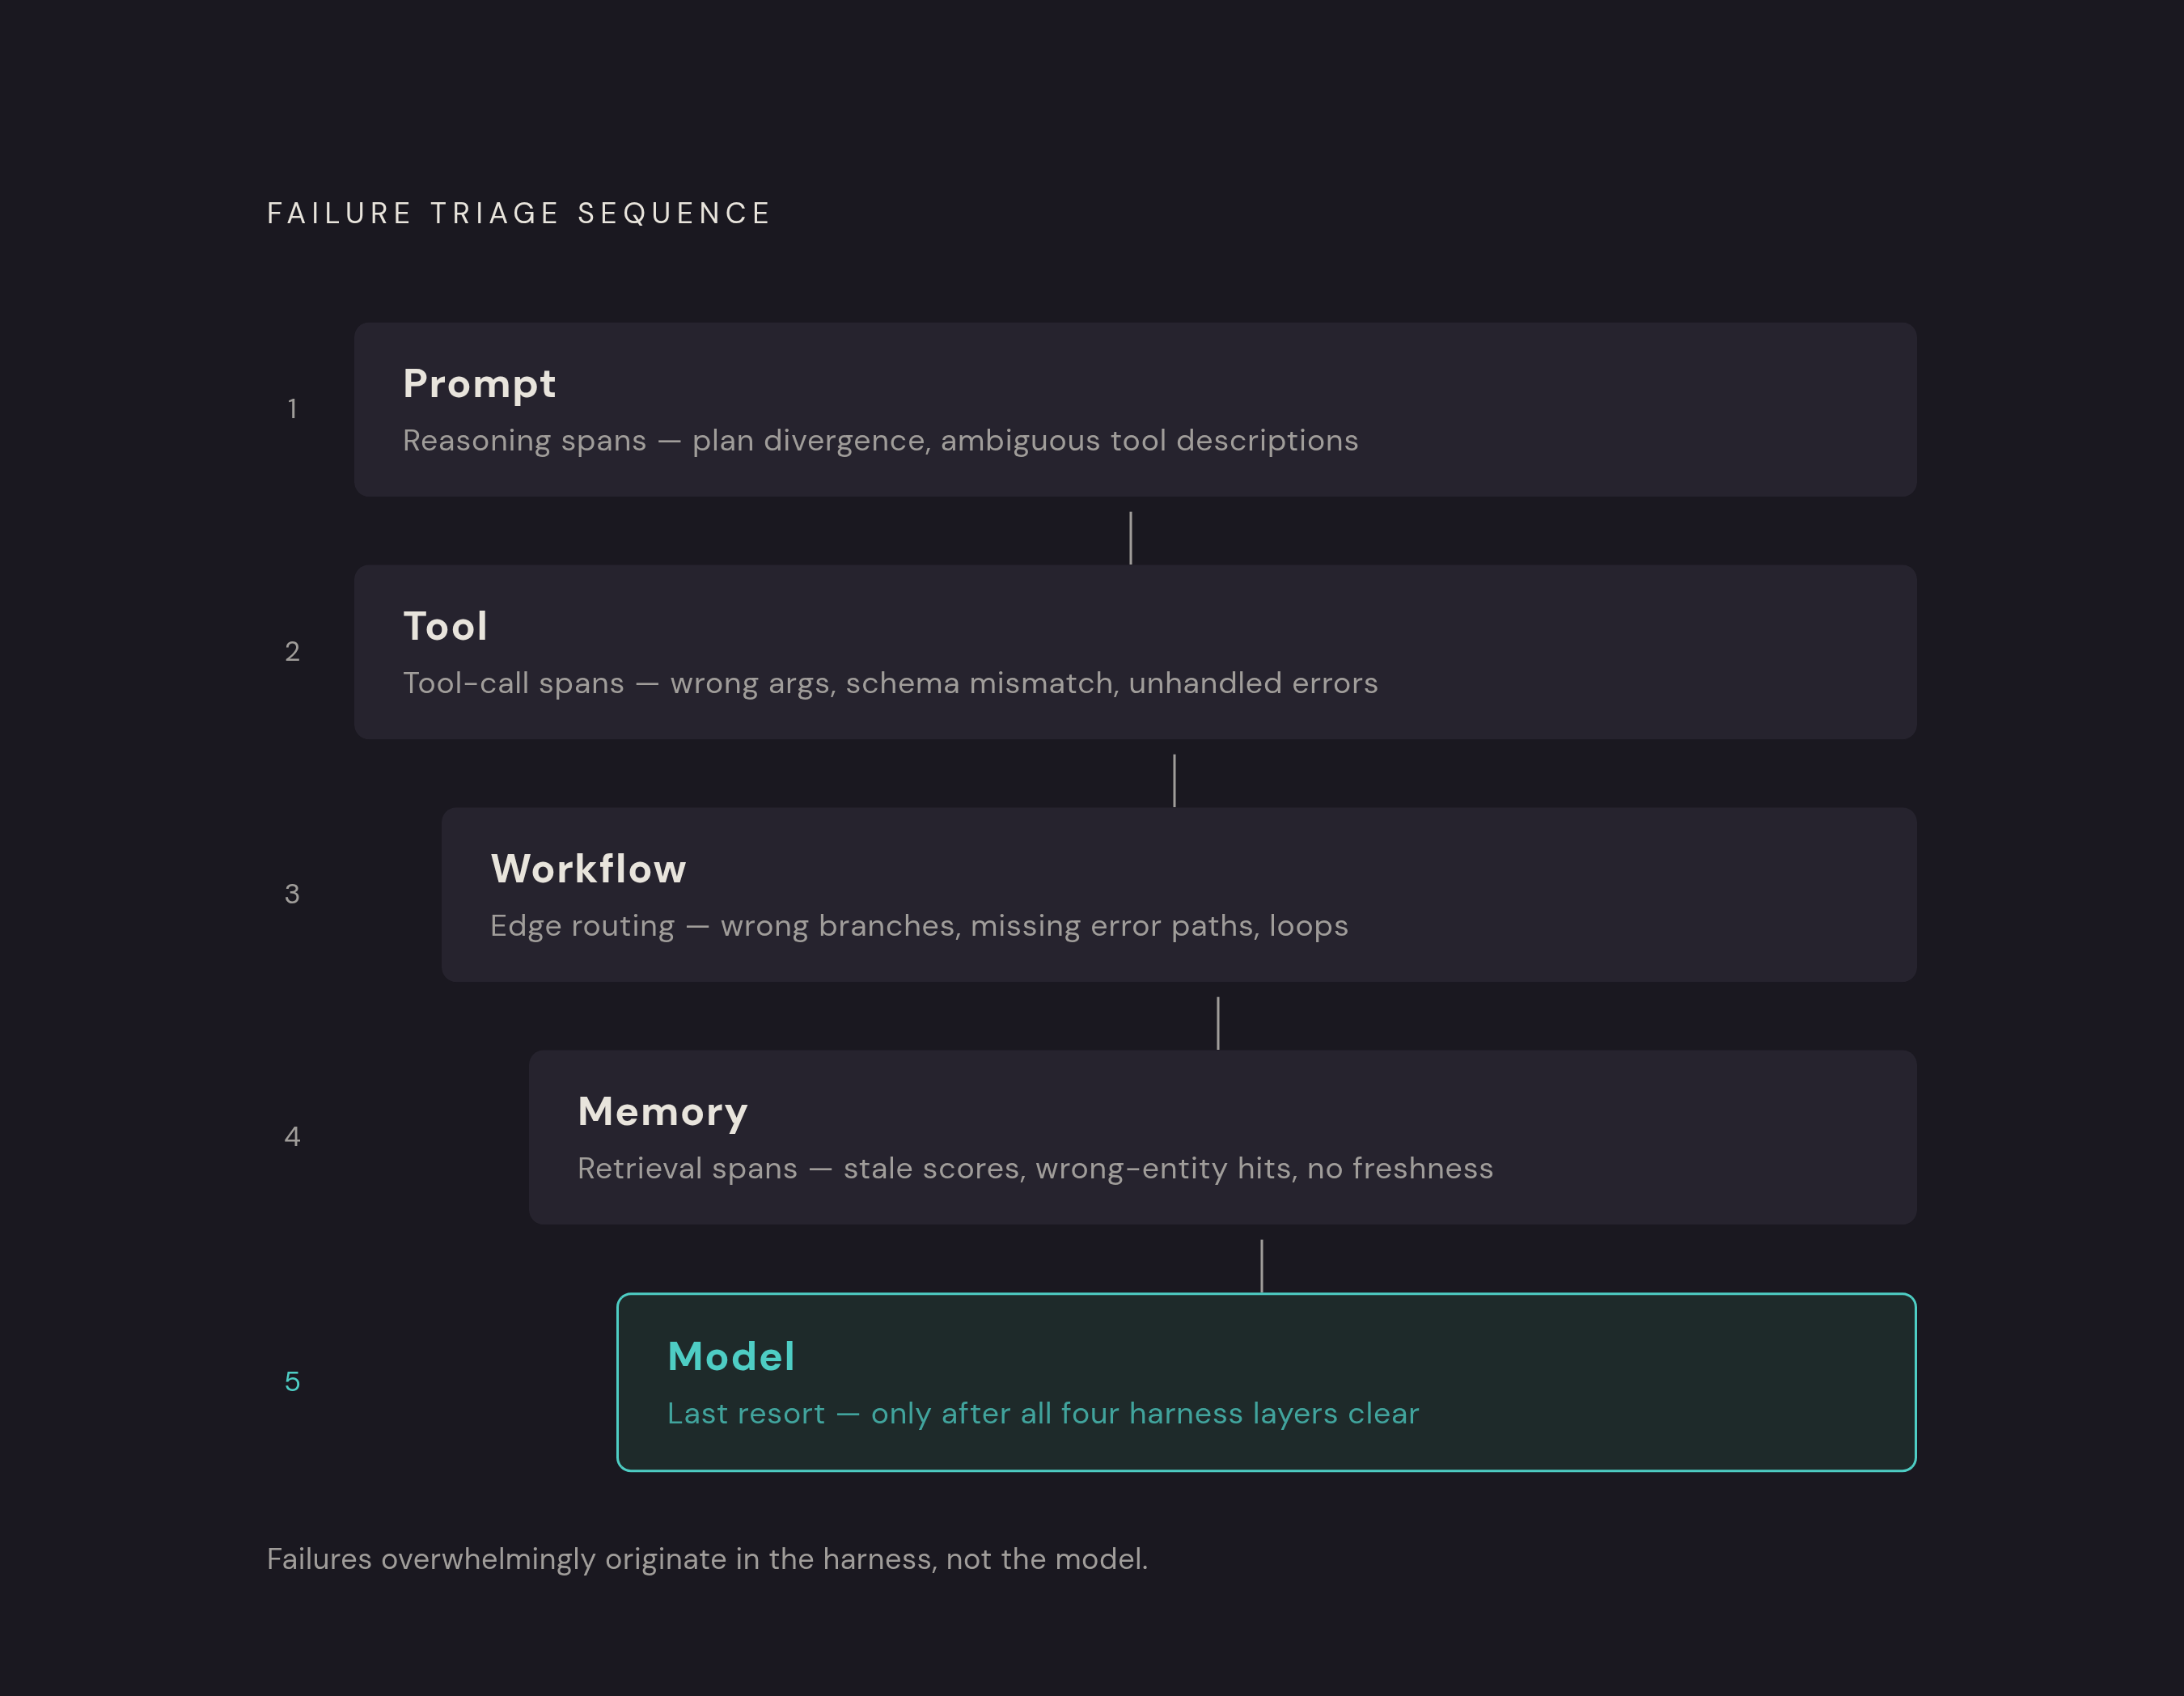
Knowing a run failed accomplishes very little on its own. A trace becomes a diagnostic instrument once it attributes failure to the prompt, the tool schema, the workflow routing, or memory retrieval. Without that attribution, every fix is a guess. Reading a trace for this purpose works best as a triage sequence, checked in order rather than as a flat list of possibilities.
Start at the prompt layer. Reasoning spans show the model's plan diverging from the task it was given, and the exact prompt sent gets captured at every LLM call span, so an ambiguous tool description appears there as the immediate upstream cause of wrong-tool selection or a retry loop. If the prompt looks clean, move to the tool layer: tool-call spans carrying wrong arguments, schema mismatches, or error states the node prompt never accounts for point at the tool definition itself rather than at the model's reasoning. If that layer looks clean too, check the workflow layer. Edge routing decisions in the trace record which conditional branch fired and on what state, and this is where wrong routing, missing error paths, and loops the graph topology should have prevented become visible. Next comes the memory layer: memory operation spans with stale retrieval scores, hits on the wrong entity, or missing freshness data point at retrieval configuration, not at the model's reasoning.
Only after ruling out prompt, tool, workflow, and memory should the model itself take the blame. If every one of those spans checks out and the output is still wrong, the failure is attributable to the model. Agent failures overwhelmingly originate somewhere in the harness rather than in the model, and the trace is what makes that attribution specific instead of assumed.
The fastest route to finding the exact failure point is comparative rather than exploratory: diffing a failed trace against a successful trace of the same task, and identifying the exact span where the two diverge, gives a direct candidate for the failure point. In a multi-step graph, this kind of root-cause analysis needs step-level traces, per-step evaluator scores, and the ability to diff failed runs against successful ones. Inspecting a single step in isolation isn't enough once a graph has more than a couple of nodes.
Validating a fix against historical traces before shipping it
Diagnosing which layer caused a failure is only half the work. A fix to a prompt, a tool schema, or a routing rule that hasn't been checked against historical traces covering the original failure case can solve that one instance while quietly breaking cases that used to pass. The workflow that avoids this starts with capturing production traces, sampling the failing and the interesting runs into a dataset, evaluating each against four transition properties (node-input correctness, node-output correctness, edge-routing correctness, and checkpoint replay determinism), clustering the failures that emerge, replaying the relevant checkpoints, optimizing against the resulting regression set, and only then shipping the fix.
Two evaluation modes support this, and they serve different purposes. Online evaluation attaches scorers directly to live production traces, so a quality regression appears there as it happens rather than after a batch review. Offline evaluation runs the agent against a curated set of golden cases before anything reaches production, and LangSmith integrates with pytest, Vitest, and GitHub workflows to run these evals on every pull request or nightly build. Production failures convert into new eval cases, so the eval suite grows out of real user behavior instead of staying frozen around a set of synthetic benchmarks written months earlier.
The value of this loop is easiest to see in a failure mode that final-answer grading alone would completely miss. A LangGraph agent can score well on task completion against a regression set, with every final answer reading as correct, and then see cost per query double a week later because the router took the expensive branch on every query that happened to mention a date, a retry loop fired repeatedly before the search tool gave up and the model fabricated an answer to cover the gap, and a reducer overwrote a constraint the planner had set two nodes upstream. A run graded only on whether the final message looked reasonable will miss all of that. The traces show it: in the edge that routed to the expensive branch, in the repeated tool-call spans before the fabrication, and in the state transition span where the constraint disappeared.