Quality, Latency, and Cost Alerting on Agent Production Traces
Unified alerting requires capturing quality, latency, and cost on the same trace.

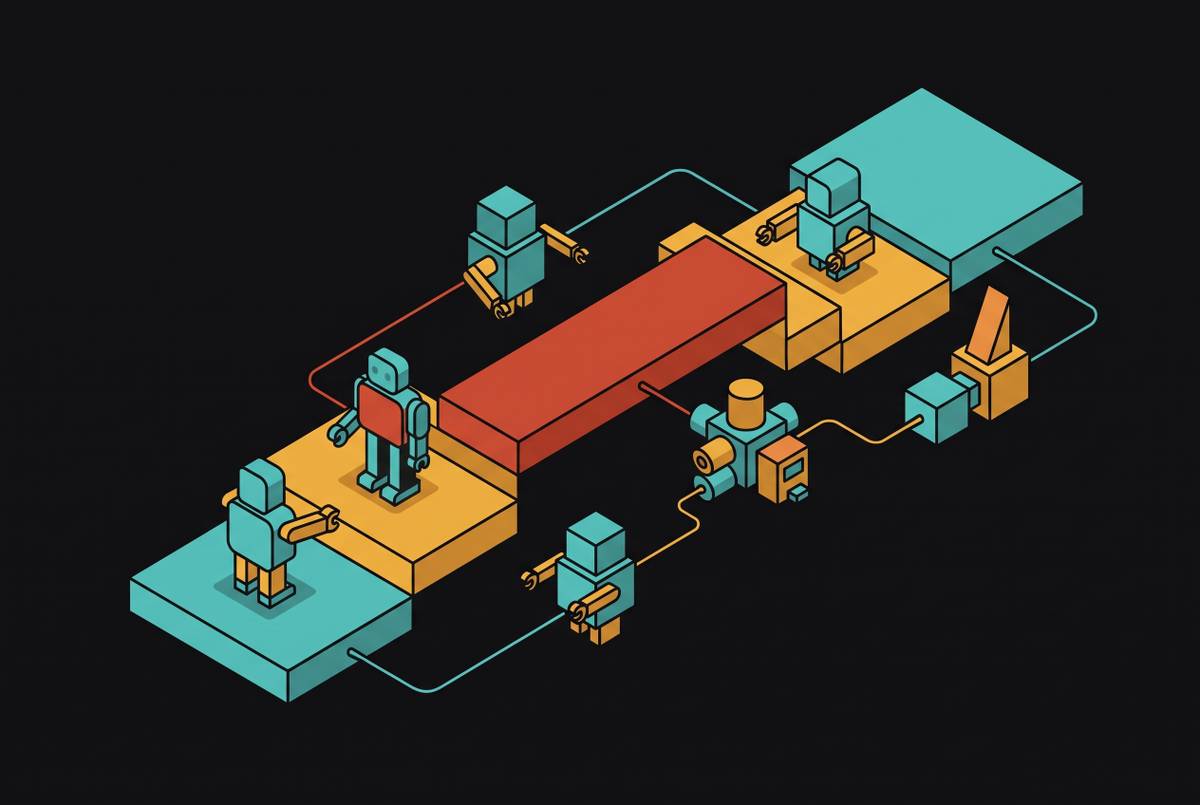
The reason these three dimensions cannot be separated cleanly is structural, and it follows from how an agent actually executes. A production agent does not return one output from one call. It routes between sub-agents, invokes tools, and chains reasoning steps, and each of those steps records its inputs, outputs, token counts, latency, and cost simultaneously as attributes of the same span. So quality, latency, and cost are not three data sources you must merge. They are three views of one operational event, and any instrumentation strategy that treats them as separate problems guarantees blind spots that no single dimension can fill on its own.
The non-determinism of LLMs in production compounds this. A failure is rarely reproducible by simply re-running the request, because the model will not take the same path twice. The only way to debug is to capture what happened the first time: the runtime state, the intermediate calls, the token consumption, the time each step took. That means the three-dimensional signal must be captured together at runtime, not reconstructed after the fact from logs that were never designed to hold it.
This is the gap traditional APM cannot close. Standard monitoring tracks uptime, latency, and error rates, and those metrics are still useful as a floor. But they cannot detect a silent quality regression like prompt drift or a slow slide in evaluation scores, because nothing in that instrumentation records what the model was actually asked to do, what context it received, or what it returned at each step. Agent observability has to explain the workflow between the user request and the final response, not just observe the output. Outcome-level metrics such as error rate and p99 latency are necessary but insufficient, because they describe the aggregate but not which step in the chain first diverged.
How the three dimensions explain each other's anomalies in production
A latency spike, a cost surge, and a quality drop are frequently the same failure expressed through three different lenses, and reading any one in isolation produces a misdiagnosis. The causal chain is not hypothetical. When an agent calls a tool with the wrong argument because of a schema mismatch or description drift, the call fails or returns an error the agent then tries to correct. Each retry consumes additional tokens, and cost rises not because traffic increased but because quality degraded at a specific step. The cost spike is a symptom, and the quality regression is the disease, but an engineer looking only at the cost dashboard sees a spending problem.
The arrow runs the other way in retrieval-heavy agents. A retrieval step that times out or returns a truncated result changes the context the model receives on subsequent steps, and that quietly degrades output quality in a way that no error signal will flag. Latency is the leading indicator. Quality is the lagging one. An alert system that watches only evaluation scores will eventually notice the drop, but by the time it does, the retrieval degradation that caused it has been running unexamined for hours.
Cost itself can function as a quality signal. Prompt caching effectiveness, measured as cache hit rate, is simultaneously a cost metric and a quality-risk signal. A cache miss on a system prompt that was supposed to be stable indicates that the prompt changed, and that change may not have gone through review. The cache miss is a cheap, automatic signal that something in the harness moved, and a monitoring system that files it under "cost" and never cross-references it against evaluation scores is discarding diagnostic value.
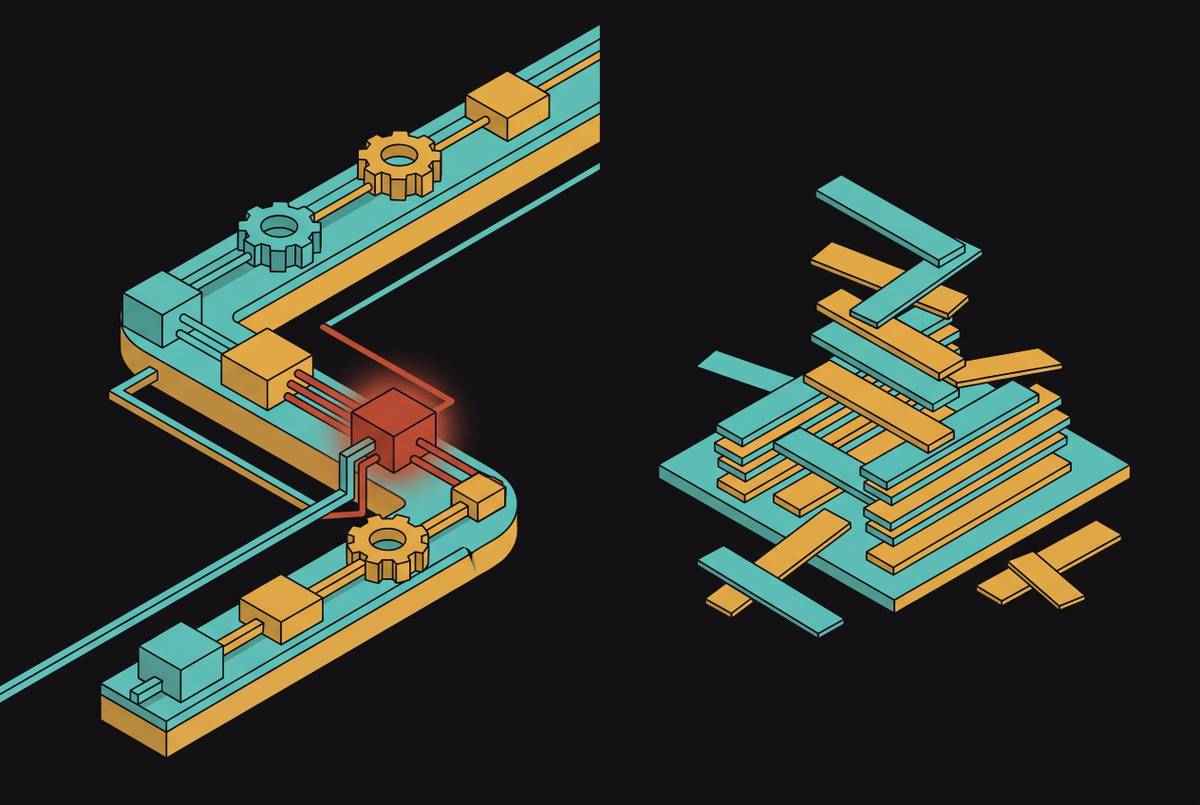
The clearest multi-dimensional failure mode is the workflow loop. Production agents need explicit limits: max iterations, max tool calls, max execution time, max cost per run. When a loop fires, all three dimensions spike simultaneously, and this is precisely the failure where separating the three alert streams most directly hides the problem. A cost alert fires, a latency alert fires, possibly a quality alert fires, and three engineers begin three investigations into what is one runaway process.
What the trace must capture for unified alerting to be possible
Unified alerting assumes unified capture, which means all three dimensions are recorded on the same span at the same granularity. Incomplete or siloed instrumentation makes cross-dimensional correlations invisible before any alert is ever configured, because the data that would reveal those correlations was never written. The minimum per-span payload is specific: every model call, tool call, or retrieval step must carry its own latency; its token counts; its calculated cost; its finish reasons, plural, under gen_ai.response.finish_reasons; its prompt version; its tool schema version; and any evaluation score assigned to that step.
OpenTelemetry GenAI semantic conventions supply the standard attributes that make this portable across tools and frameworks: gen_ai.system, gen_ai.request.model, gen_ai.usage.input_tokens, gen_ai.usage.output_tokens, gen_ai.usage.cache_read.input_tokens, and the finish reasons array. Cost is not a standard spec field, so it must be recorded as a custom attribute, but it must be calculated per span, not per session or per day. Token cost is a per-model function where input tokens, output tokens, and cached tokens each carry different rates, and if you aggregate to session level you lose the step-level attribution needed to diagnose which tool call or reasoning step drove a cost anomaly.
Beyond the individual span, complete trace visibility means every tool call, retrieval, sub-agent handoff, LLM call, retry, input, output, latency, cost, and version attached to the run. The final prompt and response are the smallest part of the story. Prompt version and tool schema version in particular must be attributes on every span, because a quality regression that follows a prompt change is only detectable if the prompt version is queryable on the same spans where evaluation scores dropped. Two capture points matter for different reasons. Application SDKs see the prompt, retrieval context, and agent reasoning steps, and that is where quality signals live. An AI gateway sees every request that reaches a model provider regardless of which team or framework sent it, and that is where cost and availability SLOs are most reliable. Neither point alone is sufficient for unified alerting.
Alert design that treats quality, latency, and cost as one signal layer
The alert payload is as important as the threshold configuration. An alert that fires on a cost surge but delivers no evaluation score and no step-level latency from the same traces is operationally equivalent to a log entry, because the engineer who receives it still has to open a dashboard and guess at cause. The design principle is that a spike in any one dimension must automatically surface the correlated state of the other two. Cross-dimensional correlation rules make this concrete: alerts should group by the same trace ID, and when a cost alert fires, the payload should include the evaluation score and the slowest span from the same trace window so the on-call engineer sees cause and effect together.
The SLO structure for LLM agents extends the Google SRE model rather than replacing it. Cost becomes a first-class SLI alongside availability, with caller errors excluded, upstream latency as a histogram, time to first token for streaming, and resilience events such as retries and fallbacks. Threshold design then diverges by dimension. Quality alerts should fire when evaluation scores drop below threshold per prompt version and per use case, because a regression in one flow will be hidden by stability in another if scores are only aggregated. Latency alerts should watch p99 provider latency histograms, time to first token for streaming, and per-step span durations, since a step-level latency spike on a specific tool call is more actionable than an aggregate response time alert. Cost alerts should track spend by team, customer, or virtual key, and should enforce hard limits that stop execution rather than only notify.
Drift detection must be per-workflow, not aggregate, and the same segmentation applies. Alert routing completes the mechanism: alerts that never reach on-call are dashboards, so routing to Slack, PagerDuty, or webhooks must carry attribution labels including team, customer, application, and API key so the right team receives the alert without manual triage. Budget controls need two levels: spend thresholds that notify as a soft limit, and limits that enforce by stopping execution or rotating keys as a hard limit. Soft limits alone turn cost incidents into delayed discoveries, because nobody acts on a notification until it becomes a page.
Root cause attribution across the three dimensions once an alert fires
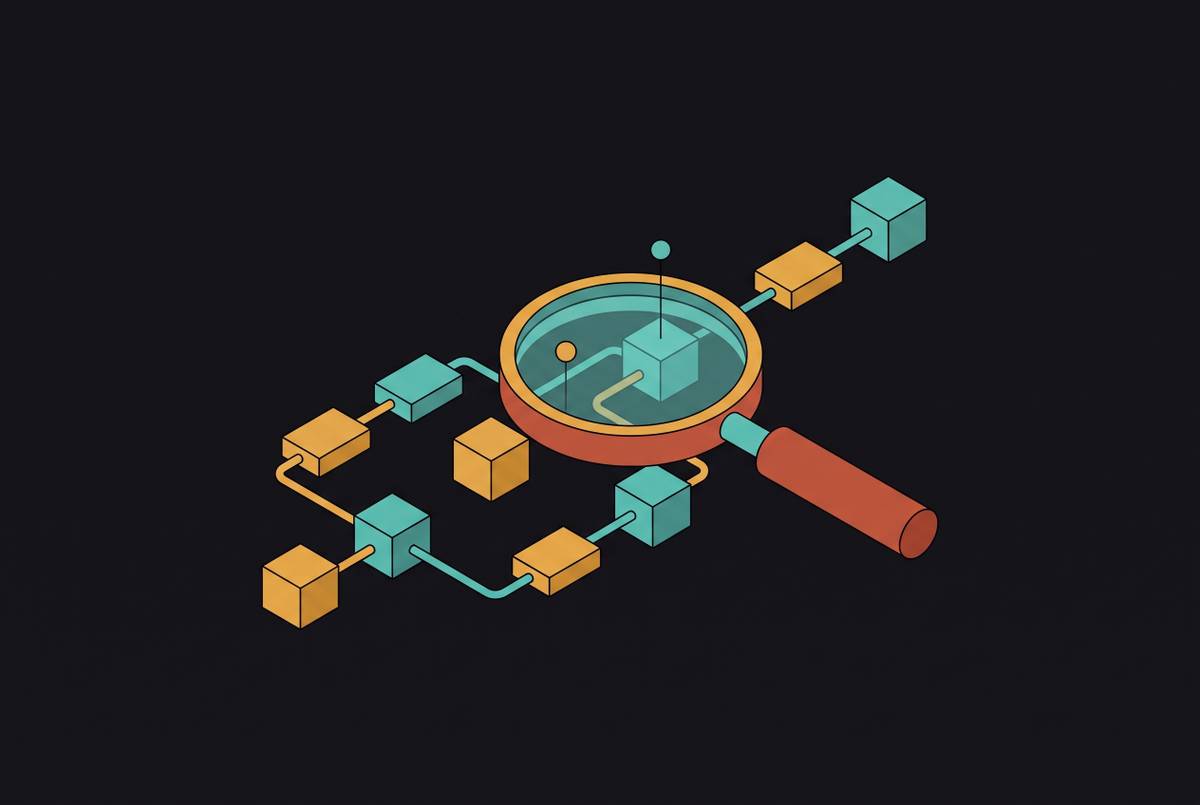
The alert is only the start of the work. Attributing a cost surge or a quality drop to a specific harness layer, whether prompt, tool, workflow, memory, or model, requires reading the three dimensions together across the full trajectory rather than inspecting individual spans in isolation. The reason is that outcome-level failure signals indicate that an execution failed but offer minimal insight into the underlying mechanism. Root cause attribution converts that thin signal into actionable diagnostic feedback by identifying the first divergence from a correct execution and assigning fault to the responsible component.
Attribution at trajectory scale is fundamentally a search problem. Execution logs for a multi-step agent can reach millions of tokens, the evidence needed to explain a failure may appear much earlier than the final outcome, and it may be distributed across distant parts of the trace. Step-level inspection fails as a debugging strategy for exactly this reason: the span that looks wrong in isolation is often the second or third consequence of a decision made many steps earlier, and the engineer who examines it alone sees an effect without its cause.
The three dimensions act as diagnostic channels that discriminate between causes. A quality drop with flat latency and flat cost points to prompt ambiguity or retrieval degradation: the model completed normally but on wrong or insufficient context. A cost spike with rising latency and degrading quality points to a loop or retry cascade, likely a tool schema drift or a workflow loop without a hard iteration limit. A latency spike with stable cost and stable quality points to a provider-side issue or a specific tool's response time, attributable to the environment layer rather than the harness. Tool schema drift is the hardest to attribute of all: a description mismatch causes behavioral drift, where the model calls the tool in situations where it should not, or does not call it when it should, and there is no error signal. The only visible artifact is a quality degradation on traces where that tool was or was not invoked, detectable only if the tool invocation path is recorded alongside quality scores.
Validating harness changes against historical traces before shipping
Shipping a harness change in response to an alert, without replaying it against the traces that triggered the alert, is shipping blind. A change that tightens a tool description to fix a quality regression may reduce token consumption and thereby improve cost, but it may also reduce the model's flexibility in edge cases and degrade quality on a different trace subset. That tradeoff is invisible without replay across the historical trace set, and the team that skips the replay discovers the regression on its next production incident.
The harness hill-climbing discipline applies directly to alert-driven fixes. Make one targeted change, replay it against the traces that exhibited the anomaly, score all three dimensions, and keep the change only if it improves the target dimension without degrading the others. Changing two variables in the same iteration makes it impossible to attribute a score delta to either change, which defeats the purpose of the exercise. Tool-trace assertions add a validation layer that checks whether execution path constraints hold, that the agent calls the right tools in the right order, so a fix to one path cannot silently break another.
The discipline belongs in CI. Validated changes should be linked back to the production traces that motivated them, so the fix and its evidence travel together through review. Reviewable, inspectable changes, not black-box auto-fixes, are the standard that makes this auditable. The alternative is the fix-and-hope cycle: teams iterate on prompts when they should be iterating on harness, evaluator, and handoff design, and the alert fires again on the next deployment because the root cause was never confirmed before the fix shipped. Alerting is only complete when it connects to a validated fix, not just a notification.