Structuring Trace Spans for Multi-Agent Orchestration
Proper span nesting and tagging pinpoints exactly where multi-agent systems fail.
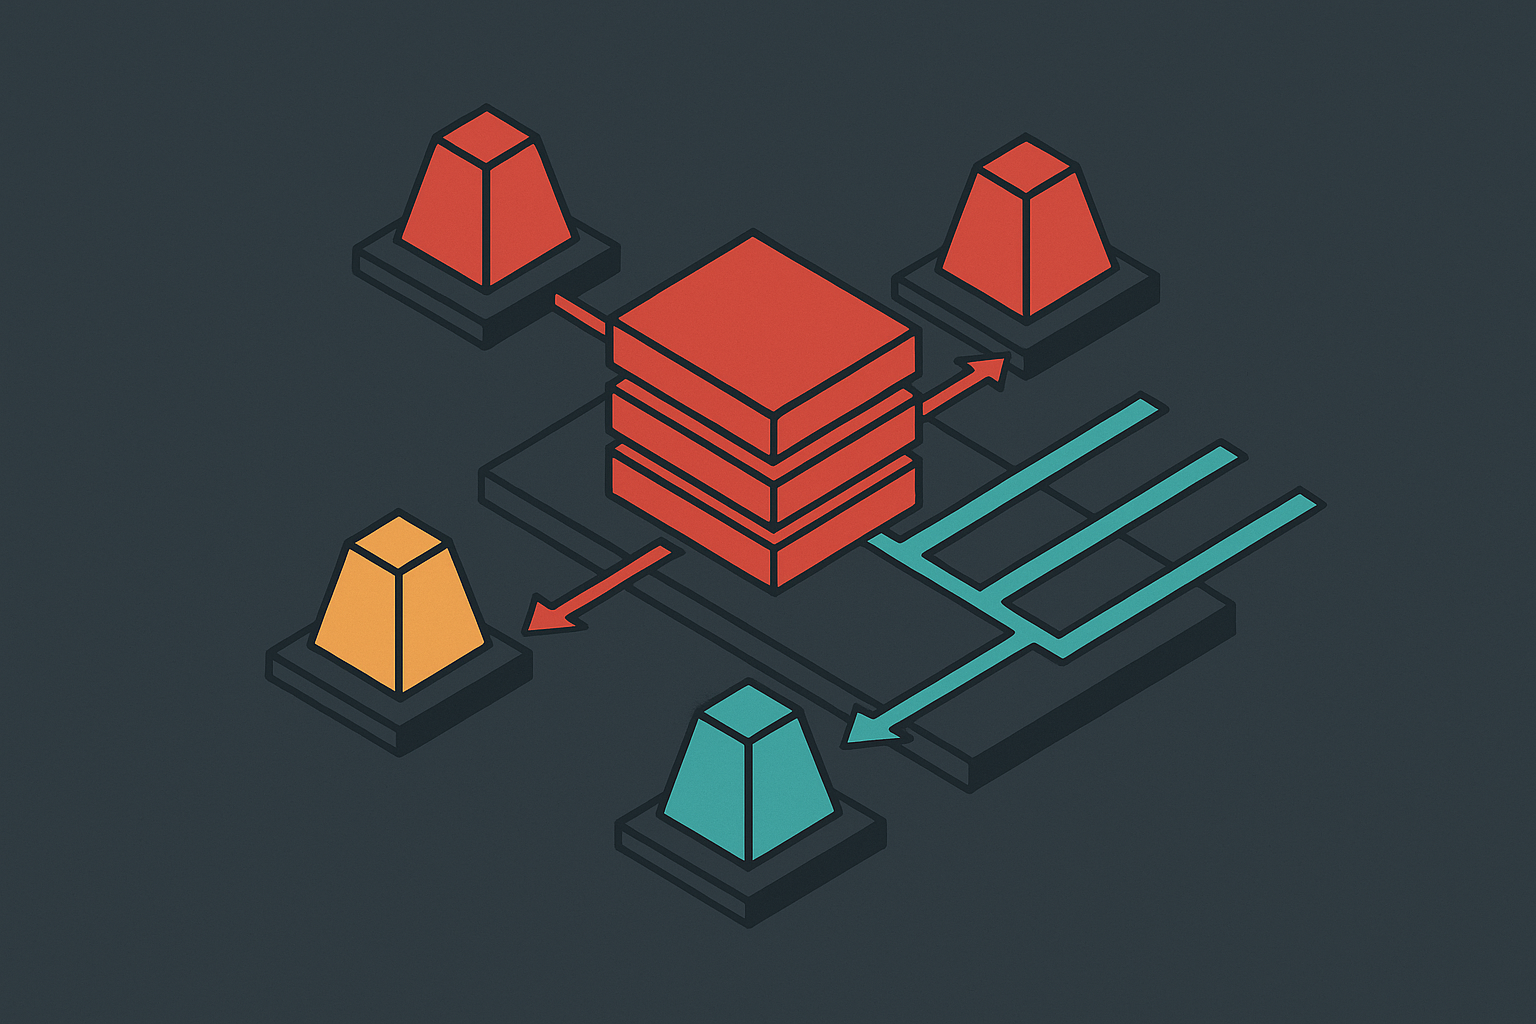
Structuring trace spans well is what separates a multi-agent system you can debug from one you can only restart and hope. When orchestration involves several agents handing off tasks, calling tools, and updating shared state, the way spans are nested and tagged lets an engineer point to the exact agent, tool call, or handoff that caused a failure, instead of leaving the team guessing at the boundary between components.
Why multi-agent failures are harder to locate
A single-agent system fails inside one execution context: one prompt, one model call, one response. When the output is wrong, the search space for the cause is bounded to that single call, and the failure is usually visible in the same place it occurred.
Multi-agent systems remove that boundary. Agents hand off tasks, share state, call external APIs, and make independent decisions, and an error introduced by one agent can propagate through every downstream agent without raising an exception or tripping a dashboard alert. A malformed tool argument passed by Agent A does not necessarily crash anything. It might simply cause Agent B to retry silently, or worse, to produce a fluent, confident, and wrong answer built on top of the bad input.
The FutureAGI observability guide catalogs four failure categories that recur across production multi-agent stacks: tool calling errors, where parameters are malformed or retries happen silently; silent context failures, where one agent passes incomplete context to the next and the receiving agent answers confidently but incorrectly; hallucination propagation, where a fabrication introduced early in the chain corrupts every step that follows; and latency compounding, where delay introduced by any single agent in a chain pushes the total response time past what a user will tolerate. None of these failure modes announces itself. Each one looks, from the outside, like a normal completed request.
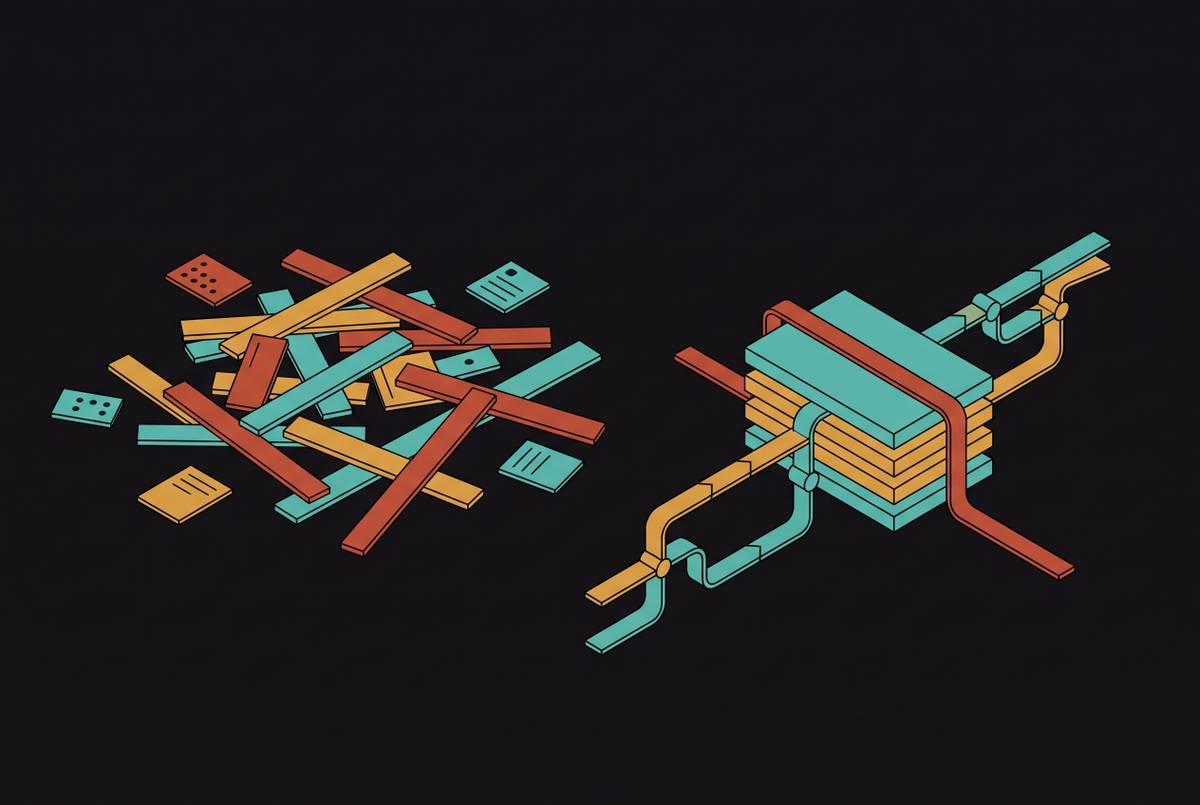
That is the actual diagnostic problem. A standard uptime dashboard can confirm that the agent service is running, but it cannot confirm that the agent picked the correct tool, passed the correct arguments, retrieved the correct memory entry, or stayed on the plan it was given. Traditional application logs, written per-service and per-process, give fragments of the story: a log line here, a log line there, none of them carrying the causal thread that connects one agent's decision to another agent's downstream mistake. Reconstructing what happened requires stitching together timestamps and guesswork across systems that were never designed to be read together. What multi-agent orchestration needs instead is a structure that preserves the causal lineage of a request as it moves through every agent, tool, and decision point it touches.
Traces and span hierarchies in a multi-agent system
Engineers with a background in distributed backend systems will recognize the underlying concept immediately: this is distributed tracing, applied to a system where the "services" are language model calls, tool invocations, and autonomous decision points instead of microservices. The same principle carries over with extensions layered on top.
A trace represents the full causal lineage of a single request through the system, from the moment a user query enters to the moment a final response leaves. It's composed of nested spans that all share a trace ID, and that shared identity is what makes it possible to follow a task across every agent handoff it passes through in a single view. Each span corresponds to one discrete operation, carrying a timestamp, a status code, a reference to its parent span, and a bag of attributes describing what happened during that operation.
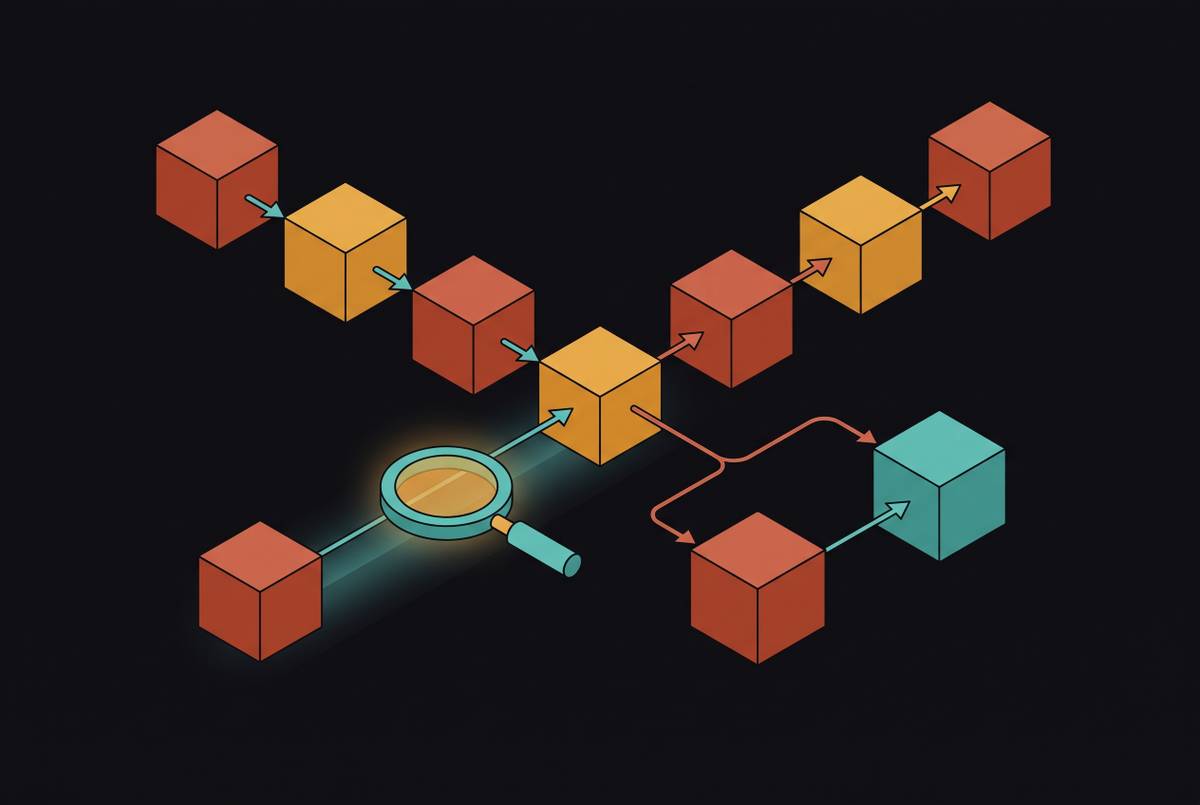
FutureAGI's guide lays out the canonical span levels for a multi-agent system. A root span covers the full workflow execution, an agent span covers one individual agent's processing within that workflow, and beneath those sit the operational spans: a tool span for an external tool or API invocation, a retriever span for a vector database or knowledge base query, and an embedding span for embedding generation. Each of these spans records input tokens, output tokens, latency, the model name involved, a status code, and an error type where applicable. When one agent hands a task to another, the receiving agent's span links back to the span that initiated the handoff, and that link is what preserves the full execution tree across the boundary between agents rather than losing the thread at the point of transfer.
A worked example makes the structure concrete. For a customer support query asking about the status of order #4521, FutureAGI's guide traces a tree with invoke_agent triage_agent as the root span. Nested inside it is a model call, chat gpt-5, taking 600 milliseconds to make the routing decision. The chain closes with invoke_agent response_agent, running 800 milliseconds to compose the final answer. Every span in that tree is clickable and walkable backward, so an engineer looking at a wrong final answer can trace it step by step to the exact operation where something went off course.
MLflow's 2026 developer guide describes the same underlying mechanism from a different angle: each discrete reasoning step an agent takes generates its own distinct span, and those spans nest hierarchically so that a single parent trace for one complete agent run contains child spans for every LLM call, every tool invocation, every memory read and write, and every handoff to a sub-agent. The hierarchy is the record of the system's reasoning as well as its outputs.
The four span types that must be present for attribution to work
A span hierarchy only supports root cause attribution to the extent that it captures the right categories of operation. Root cause attribution in a multi-agent trace is only as good as the span types it contains, and omitting any one of the four core types leaves an entire category of failure invisible no matter how detailed the rest of the trace is.
Four span types each map to a specific failure mode only that span type can surface:
- Tool-call spans record the tool name, the arguments passed, the raw output returned, duration, retry count, and error state. Without this level of detail, hallucinated arguments and silent retry loops are indistinguishable from normal traffic.
- Reasoning spans record the model's plan, the action it selected, the observation it made in response, and what it decided to do next. Plan drift and wrong-branch selection become visible in a reasoning span in ways a single undifferentiated LLM span cannot show.
- State transition spans record the state before and after each step, along with context edits and handoff payloads. This is what catches context loss and summarization drift, the kind of degradation that accumulates quietly across a long-running agent chain.
- Memory spans record reads and writes to long-term stores: the query issued, the entries returned, their relevance scores, and their freshness. This exposes stale reads, retrieval against the wrong entity, and memory leakage between users.
A fifth category, handoff spans, records the source agent ID, the target agent ID, the size of the context payload transferred, and the transfer latency. MLflow's guide records the source agent ID, target agent ID, context payload size, and transfer latency, making agent-to-agent handoff a first-class observable event rather than an implicit state change.
The argument for treating all of these as required, not optional, comes down to a simple fact about how each failure mode manifests. Each span type is the only place its corresponding failure mode becomes visible. A missing tool-call span does not just leave a gap that better logging elsewhere can fill. It leaves tool-level failures permanently invisible, because no other span type records the data needed to detect them. The same holds for reasoning, state, memory, and handoff spans individually: each is a blind spot until it exists.
Span attributes, business metadata, and querying across failures
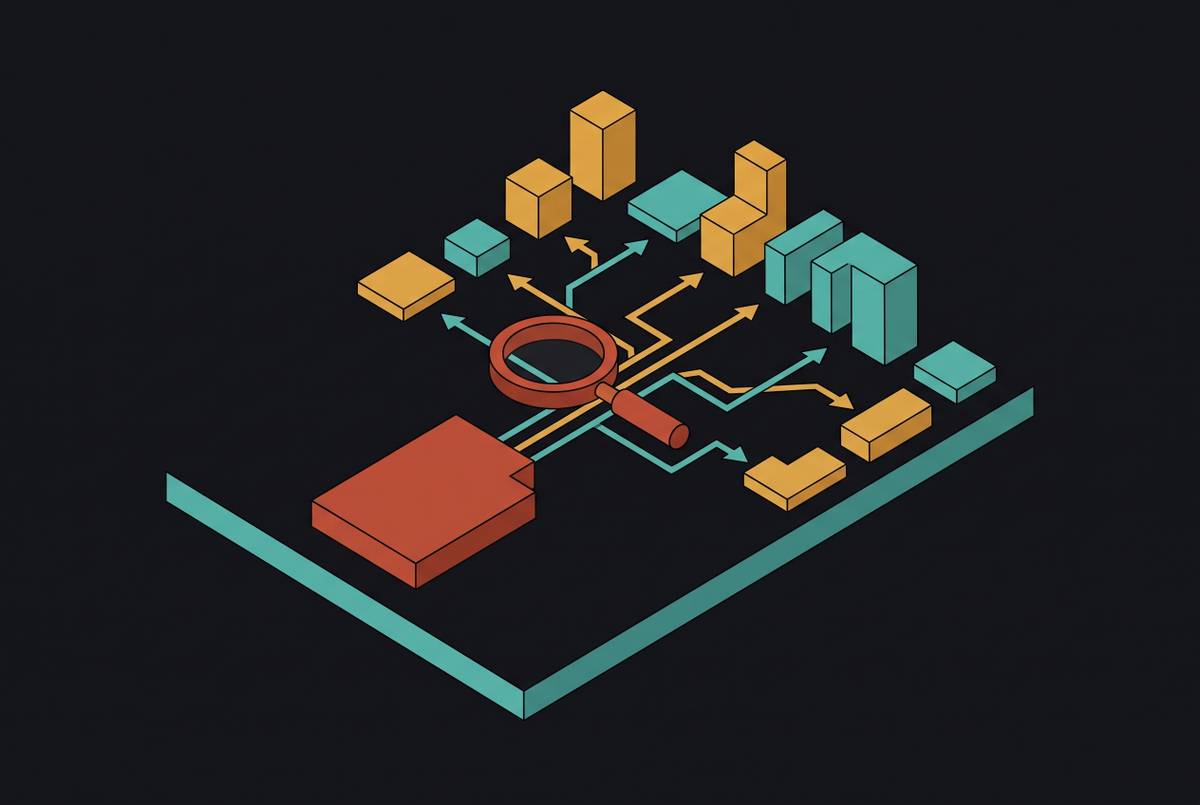
Having the correct span types in place solves only half the problem. A correctly typed span hierarchy that carries thin, generic attributes still produces a system that can only be inspected one trace at a time, which is a black box the moment volume scales past a handful of manual reviews. Tagging every span with structured business metadata is what turns individual trace inspection into pattern detection across thousands of runs.
MLflow's guide draws this distinction directly: without structured tags on spans, an engineer can replay a single failing trace and understand what happened in that one instance. With structured tags in place, the same engineer can query across every failure in a given time window, filtered by tool, by user segment, or by any other dimension the tags encode.
The recommended practice is to attach identifying attributes like user_id, session_id, and a strategy or workflow identifier to every span from the moment instrumentation is built. Adding these fields retroactively, after a production incident has already made clear they were missing, means the incident itself cannot be fully explained, because the traces captured during it don't carry the fields needed to segment it. Compare a tool-call span that logs only a status code and duration to one that also carries the user segment and the specific workflow that invoked it. The first tells an engineer that something failed. The second tells them that a specific tool failed specifically for a specific user segment during a specific workflow, which is the query that actually leads to a fix.
High-cardinality attributes make that kind of per-operation filtering possible. Aggregate metrics, the kind that appear on a standard dashboard as an overall error rate or a p95 latency number, cannot isolate a claim like "tool X failed specifically for segment Y." Answering that question requires attributes attached at the level of the individual span.
Shared schema matters here too. The OpenTelemetry GenAI specification provides a common structure for these attributes, so traces produced by different frameworks can be ingested into a single backend rather than each framework requiring its own custom parsing logic. FutureAGI's guide notes that these OpenTelemetry GenAI semantic conventions stabilized in 2026, which has made vendor-neutral observability the baseline expectation for any team building multi-agent systems, rather than a differentiator.
The practical consequence separates two kinds of teams. A team instrumenting with only the defaults a framework provides out of the box ends up with latency numbers and error rates: useful for knowing that something is wrong, useless for knowing what class of request is affected or why. A team that adds business-level attributes on top of that same span structure gets failure segmentation instead, and that segmentation is what turns an incident report into a fix.
The three failure categories where span hierarchy makes attribution tractable
Span hierarchy does not illuminate every failure equally. Some categories depend on a specific part of the hierarchy being present and correctly attributed before the underlying cause becomes visible.
Tool schema drift is the first. An agent can pass every test in staging and still degrade in production because a single tool argument's name or type changed on the provider's side. There is no outage banner and no stack trace, only a quiet drop in task completion rate and a rise in retries. The tool-call span is the only place this failure can surface. If that span records the actual argument name the agent passed, alongside the schema the tool expected, the mismatch is directly inspectable. If the span records nothing more than a status code, the cause stays invisible no matter how much else is logged around it. The diagnostic path runs through querying tool-call spans for argument key mismatches across a rolling window: a spike concentrated in one argument pattern points straight at a schema change.
Prompt ambiguity driving fabricated tool invocations is the second. FutureAGI's guide notes that agents calling tools which do not exist in their schema happens most often when they are prompted with examples drawn from a different deployment, or when the system prompt leaves the set of available tools ambiguous. Reasoning spans are what surface this: the model's intermediate plan names a tool that never appears in any tool-call span that follows it, and a reasoning span recording the intended action alongside the action actually taken makes that divergence visible. Without a reasoning span capturing intent separately from execution, a fabricated tool call looks indistinguishable from a tool call that simply returned an error.
Workflow loops from failed error recovery are the third. A tool returns a 4xx error, the model fails to read the error body, the next retry sends the identical broken arguments, the loop runs until it hits the maximum step ceiling, and the agent fabricates a successful-looking response to mask the failure rather than surfacing it. A per-call rubric evaluating each individual step in isolation never catches this, because each step looks locally reasonable. Catching it requires looking across the full span tree for repeated tool-call spans carrying the same arguments and an escalating retry count, which is only possible when retry count is recorded as a first-class attribute on the span rather than buried in a log line. State transition spans make an update failure directly visible: if the agent's working memory is not being updated between retries, that failure to update appears in the before-and-after state recorded on each state-transition span, identifying the loop structurally rather than leaving it as a count of repeated calls that looks suspicious in hindsight.
These cases share the same underlying pattern. A failure is attributable to the layer responsible for it only when the span at that layer carries the attribute that would reveal the mismatch. The span hierarchy does not make attribution automatic. It makes attribution possible when the right data was captured at the right layer.
How parent-child structure enables handoff attribution
The hardest attribution problem in a multi-agent system is the one naive instrumentation cannot touch: a failure that originates in one agent but only becomes visible in another. This is the failure mode most unique to multi-agent orchestration, because it has no equivalent in a single-agent system where there is nowhere else for the cause to hide.
The mechanism that makes this solvable is structural. When Agent A hands off to Agent B, Agent B's root span is created as a child of Agent A's span, and both carry the same trace ID. That parent-child link is what makes the full causal chain traversable inside a single tree, rather than requiring an engineer to manually correlate separate log streams produced by each agent independently. FutureAGI's guide describes this at the workflow level: a single INTERNAL invoke_workflow span acts as the parent wrapping several invoke_agent children, and that wrapping structure is what allows a task to be followed across every agent handoff inside one trace rather than several disconnected ones.
Return to the order-status trace. The root invoke_agent triage_agent span hands off, through a nested routing decision, to invoke_agent order_lookup_agent, which itself contains the tool call to order_api and a follow-up model call, before handing off again to invoke_agent response_agent. Each of those handoffs is a parent-child link carrying the same trace ID forward. An engineer looking at a wrong final answer from response_agent does not need to guess where the process went wrong. They can walk backward up the tree, agent by agent, until they find the point where the data or the reasoning diverged from correct.
Treating the handoff itself as a distinct span type sharpens this further. Recording the source agent ID, the target agent ID, the size of the context payload, and the transfer latency at the moment of handoff means an engineer can measure not just whether a handoff completed, but whether the context that crossed the boundary arrived complete and correct. That distinction catches a specific and common failure pattern: Agent B produces a wrong answer while its own LLM calls and tool calls all look perfectly healthy in isolation. Walking up to the handoff span reveals that the context payload collapsed in size during transfer, which points the cause back to a summarization step inside Agent A rather than anything Agent B did wrong. Without a handoff span recording payload size explicitly, that failure would have been misattributed to the agent where it became visible instead of the agent where it originated.
Some orchestration frameworks instrument each agent independently by default, which makes cross-agent parent-child linking optional rather than automatic. The consequence is that every agent can appear healthy when inspected on its own, while the system as a whole still fails, which is exactly the silent failure mode that a proper span hierarchy exists to prevent. Frameworks that emit OpenTelemetry-compatible traces with explicit parent references avoid this by default rather than requiring it to be bolted on afterward. By 2026, OpenTelemetry-compatible tracing had become the standard integration target across the major orchestration frameworks, including LangGraph, CrewAI, the OpenAI Agents SDK, Microsoft's Agent Framework, and AutoGen v0.4 and later, which has made vendor-neutral parent-child linking a baseline expectation for any serious multi-agent deployment rather than a custom integration project each team has to solve on its own.
The structural lesson holds regardless of which framework is doing the orchestrating: attribution across agent boundaries requires the boundary itself to be recorded as a span, not inferred after the fact from two agents' separate logs.