Sampling Strategies for High-Volume Agent Trace Pipelines
Head and tail sampling together catch the failures that standard APM misses entirely.

Agent traces have no meaningful baseline, and the sampling strategies built for conventional services quietly destroy the evidence needed to debug them. For capacity protection, you pair a conservative head-based rate with a stateful tail-sampling tier that keeps every failed, expensive, or anomalous trace intact. This two-stage design is not an optimization. It's a prerequisite for operating agent workloads in production.
Why agent traces break the assumptions that conventional sampling was built on
A traditional web service trace has a predictable shape: a handful of database queries, a cache hit or two, a response out. APM tools evolved to slice that shape well because the distribution of traces clusters tightly around a modal path. An agent trace looks nothing like this. It fans out into LLM calls, tool invocations, sub-agent handoffs, retry loops, and retrieval steps, with latency and cost spread across all of them. MLflow's 2026 sampling guide flags agent and LLM calls as a category where full-fidelity tracing is crucial because each output can be non-reproducible in a way a typical HTTP request isn't.
The variance is not merely high. It is structurally asymmetric. Most agent runs are unremarkable, cheap, and fast. The runs that matter most, failures, loops, cost spikes, schema mismatches, are rare and bear no resemblance to the modal run. A uniform probabilistic sampling rate is calibrated to the majority shape, so it systematically undersamples the minority that carries the diagnostic signal. This asymmetry is exactly what flat head-based sampling destroys.
Four failure modes standard APM misses entirely illustrate the stakes. Tool-call failures with invalid arguments, silent context truncation, runaway retry loops, and quality regressions hidden behind ostensibly successful responses all produce traces that look healthy at the aggregate level. These are precisely the cases a flat sampler drops, because their defining characteristic is that they don't announce themselves through conventional error channels.
What head-based sampling gets right and where it structurally fails for agent workloads
Head-based sampling solves a real capacity problem, and dismissing it would be a mistake. The decision to keep or drop a trace happens at trace start, before any outcome is known. This is its strength: it's cheap, stateless, and easy to reason about. OpenTelemetry's TraceIdRatioBased sampler hashes the trace ID for consistent decisions across independent collector instances. SDK-side sampling drops the decision before spans leave the process, saving bandwidth. Collector-side probabilistic sampling centralizes policy changes without redeploying services.
Per-service rates matter in practice. A checkout service with modest traffic might run at full capture, while a high-traffic search endpoint samples at a very low rate. A single global rate either drowns low-traffic services or floods high-traffic ones. And the capacity protection is real: once ingestion, indexing, or query load starts choking under full trace volume, head sampling is the pragmatic move. The threshold where sampling typically becomes necessary is a few hundred traces per second.
But the blindness is structural, not tunable. A trace dropped at the source never reaches any downstream processor that could evaluate it. If the head rate is too aggressive, the tail sampler is starved of raw material before it can act. For agent workloads specifically, the dropped traces are not a random cross-section. They are proportionally drawn from the majority of successful, cheap, fast runs, which means failures are dropped at the same rate as successes. The signal ratio is destroyed exactly when an incident hits.
How tail-based sampling recovers the traces head sampling would discard
Tail-based sampling operates on completed traces, which means it can apply rules that are impossible at trace start. It can keep every error, keep anything above a latency threshold, keep rare operation types, and drop only what remains. MLflow's sampling guide describes the OpenTelemetry Collector's tail_sampling and probabilistic processors as the practical starting point. The tail_sampling processor buffers spans from a completed trace, evaluates policy rules in order, and emits or drops the trace as a unit.
Rule ordering matters critically. Specific rules, for errors, latency outliers, and rare operations, must run before the generic probabilistic fallback. A probabilistic rule that runs first can drop a failed trace before the error rule ever fires. For agent workloads, tail rules map directly onto the failure categories that matter: keep all traces with a non-200 tool response, keep all traces exceeding a token-cost threshold, keep all traces where span count exceeds a loop-detection ceiling, keep all traces where an eval score falls below a quality floor.
This recovery requires stateful infrastructure. Spans from the same trace must arrive at the same collector instance, which demands consistent hashing or sticky routing in front of the collector tier. This is the architectural cost head sampling avoids. The buffer size and timeout are real configuration choices: a buffer that is too small drops spans before the trace completes, and a timeout that is too long delays the emit decision and inflates collector memory. Tail sampling beats head sampling for the specific categories that dominate agent incident investigation, failed traces, expensive traces, and anomalous traces. MLflow's guide is explicit that keeping every failed, expensive, or anomalous trace in full while sampling the happy path aggressively is the right posture for agent workloads.
The two-stage hybrid architecture that pairs these mechanisms correctly
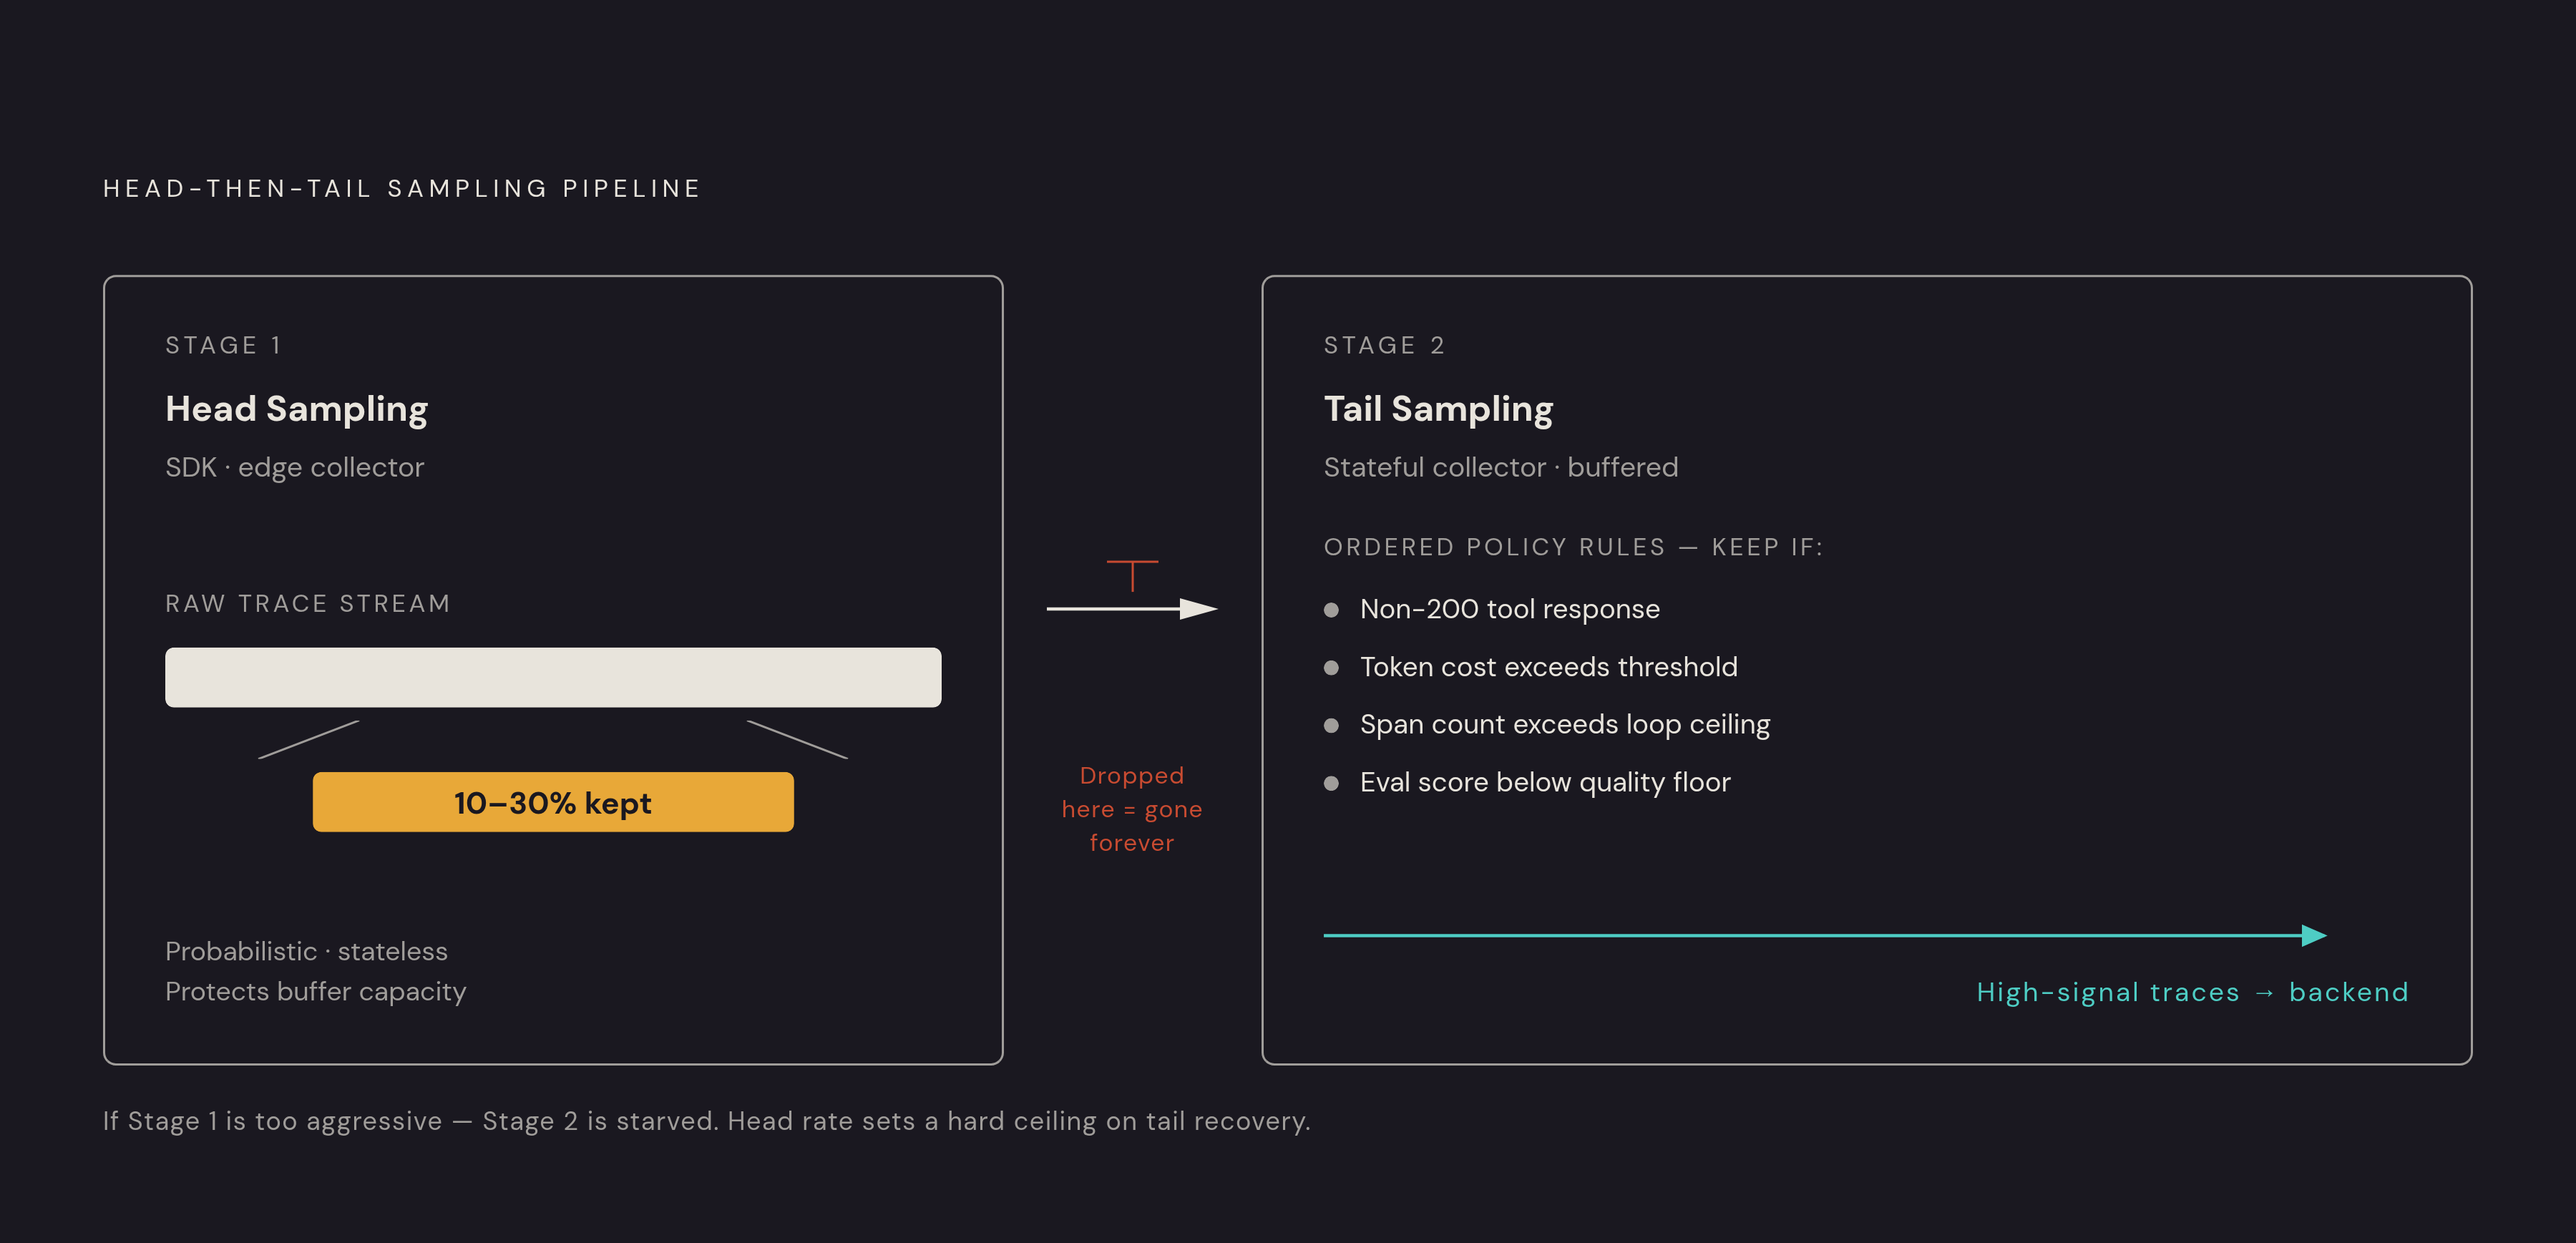
The pragmatic production default combines both mechanisms in sequence. Head sampling protects capacity at the source, and a buffered tail-sampling collector tier downstream recovers the traces that actually matter. Stage one is head sampling at the SDK or edge collector, set per-service to keep ingestion volume within budget. This is the only mechanism that prevents the pipeline from being overwhelmed before a trace reaches the buffer. Stage two is a stateful collector tier that buffers complete traces and applies tail policies, for error detection, latency thresholds, token-cost outliers, and loop signatures, before forwarding survivors to the observability backend.
The dependency between stages is the critical calibration constraint. If the head rate at stage one is too aggressive, traces are discarded before they enter the buffer, and the tail sampler cannot recover what was never buffered. The head rate sets a ceiling on the tail sampler's recall. MLflow's sampling guide recommends 10–30% head-based sampling at the trace level in production as a typical range for cost management, with tail-based sampling triggered on errors or high latency. This range exists specifically to leave the tail sampler enough material.
Two operational details determine whether the architecture actually works. In a multi-step agent trajectory, the trace spans LLM calls, retrieval steps, and tool invocations as a parent-child hierarchy. The root span must be created at the very start of the request lifecycle because batch processors buffer child spans until the root arrives. A late root span causes silent aggregation failures. And dynamic adjustment at the collector tier prevents buffer overload during traffic spikes: the tail processor can shed the lowest-priority traces, the high-volume happy-path runs, when buffer pressure rises, preserving capacity for the error and outlier queues.
Stratifying the eval layer on top of the sampling architecture
Once the hybrid architecture ensures high-signal traces survive, a stratified eval strategy extracts diagnostic value from them at a cost that scales with each tier's evidence quality. Heuristic evals are deterministic assertions on individual agent steps. Did the router pick the correct branch? Did the tool-call output parse as valid JSON matching the schema? Did the retrieval step return a document above a relevance threshold? These are fast, cheap, run on all traffic, and belong in CI. Human review is reserved for a fraction of a percent of eval-flagged traces, the cases where automated scoring is uncertain or the stakes are high enough to require a human judgment call.
The bias in LLM-as-judge sampling is where the hybrid architecture pays off. Because the tail sampler has already concentrated failures, expensive runs, and anomalies in the retained set, the 10–20% LLM-as-judge sample drawn from that set is far richer in diagnostic material than an equivalent random draw from the full stream would be. Scheduled replay of a golden trace set against current production is the most reliable early warning for drift induced by model updates, prompt edits, or tool schema changes.
Root cause attribution requires step-level traces, not outcome labels
Preserving traces is necessary but not sufficient. Outcome-level failure labels cannot support agent root cause attribution because the step where an error surfaces is often not the step that caused it. The taxonomy assigns 41 failure modes to an edge between two components, such as tool to model or environment to agent, with a fault side indicating where the repair belongs. This structure is only recoverable from step-level traces, not from aggregate metrics or final-output logs.
Tool schema drift illustrates the attribution problem concretely. If a tool wrapper suppresses an error and the model never observes the failure, the label is tool-to-model with the fault on the tool. If the wrapper returns the error but the model ignores it, the label is tool-to-model with the fault on the model. The interaction looks identical at the output level but requires different repairs. Execution logs can reach millions of tokens, and the evidence needed to explain a failure may be sparse, appear much earlier than the final outcome, or sit distributed across distant parts of the log. Attribution is fundamentally a search problem requiring the system to test multiple plausible explanations and rule out contradictory evidence.
A concrete system, AgentDebugX (Zhu et al., 2026, arXiv:2607.18754), implements a closed loop of Detect, Attribute, Recover, and Rerun. On the GAIA benchmark, applying its diagnosis in a single rerun repaired a meaningful share of initially failed trajectories and raised overall accuracy substantially. Step-level instrumentation is the prerequisite for all of this. Capturing spans for LLM calls, retrieval steps, and tool invocations separately, with per-step latency, token counts, tool call arguments, and response payloads, is what makes the evidence space searchable. A trace that records only the final output is forensically useless.
The failure categories that most often survive into the retained trace set
The failures a well-configured tail sampler preserves cluster into a small set of categories, each with a distinct signature in the trace and a distinct repair target. Tool schema drift is the most dangerous because it is silent. The tool returns data, but the data does not conform to the contract the agent was promised: wrong field types, missing required keys, invalid JSON, truncated payloads. Agents without explicit schema validation cannot distinguish a transient network error from a structurally broken response, so identical retries produce identical garbage. The signature is a tool call span that returns a 200 with a payload that fails downstream parsing, followed by spans showing the agent looping or fabricating a result rather than surfacing the failure. The repair target is the tool wrapper, not the model. Adding schema validation at the wrapper level catches this before the model observes it.
Context truncation follows a different pattern. Long-running agents accumulate transcript content until the context window is exhausted. When truncation occurs, the agent produces output that is plausible but disconnected from the truncated content. The signature is an input token count that approaches or hits the model's context limit on a child span, with subsequent output quality dropping while the span status remains successful. The repair target is context management in the harness: checkpointing, summarization, or sliding-window strategies.
Workflow loops are the most visible category. The agent retries the same broken step with minor variations, burning tokens without converging. The signature is a span count for a single trace that exceeds a ceiling, with tool call arguments differing only trivially across iterations. The repair target is loop detection and exit conditions in the workflow layer. Prompt ambiguity and planning drift complete the set. Each step in a prompt chain compounds small errors from the previous step until the final output is unrecognizable. Gates between steps catch drift, but only if the trace preserves per-step outputs for comparison. These are goal alignment failures and cannot be detected from a single output. They require diffing failed runs against successful ones at the step level.
Harness iteration on retained traces as the feedback loop that closes the cycle
Retained traces from the hybrid sampling architecture are the input to harness iteration, and replay against those traces, not synthetic benchmarks, is what makes a proposed change safe to ship. The harness, meaning the prompts, tool wrappers, workflow logic, memory, and context management, is the primary site of improvement for production agent teams because it is editable without model retraining and can improve with accumulated evidence. Replay is the mechanism that makes harness iteration safe. A harness provides a repeatable way to define golden tasks, replay tool calls deterministically, score runs with real rubrics, and block regressions in CI. Two execution modes are required. Live mode with real tools and real network works for canaries and smoke tests against production. Replay mode with recorded tool responses and a deterministic environment works for CI and regression attribution against the retained trace set.
A 2026 continual learning framework, Harness Continual Learning (arXiv:2608.19013), formalizes this as guarded harness evolution. Candidate harnesses are proposed from post-execution feedback and committed only after checking current improvement, historical retention, and validity. The Continual Evaluator rejects any edit that improves performance on newly targeted tasks at the cost of regressing on tasks the agent previously solved. The live self-improvement framework PILOT (arXiv:2608.26530) extends this further: self-improvement is live, using emerging experience both to redirect the active run and to update the persistent harness.
The strongest objection to harness-iteration-first is catastrophic forgetting. A change that fixes the newly observed failure pattern may silently break a class of runs that was previously reliable. The guard in Harness Continual Learning addresses this directly, but the gate must be calibrated so it does not reject every useful update opportunity. The connection back to sampling is direct. A retained trace set biased toward failures, expensive runs, and anomalies, the output of a well-configured tail sampler, is a better replay corpus than a random sample. The harness change is validated against the cases most likely to reveal regressions, and the entire pipeline becomes a learning system.